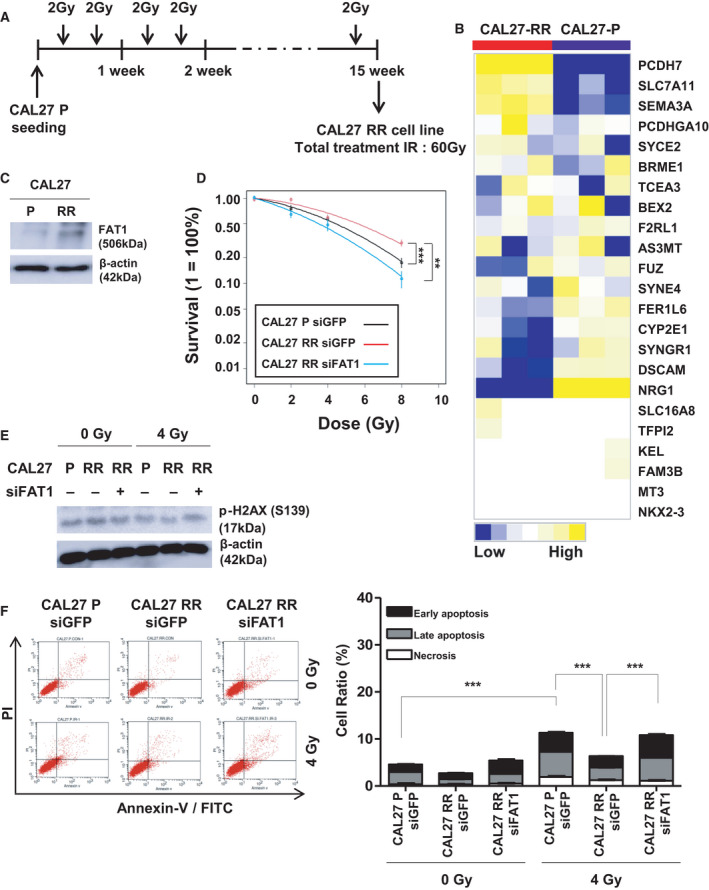
Fig. 6.

FAT1 regulated sensitivity of radiotherapy in HNSCC. (A) The process of in vitro radiation selection in human HNSCC cell line, CAL27. (B) RNA‐sequencing analysis was performed on the established radioresistant cell line, CAL27‐RR (n = 3) and parent cell line, CAL27‐P (n = 3). Heatmap showing the gene distribution after hierarchical clustering of RNA‐sequencing data. (C) FAT1 protein levels in CAL27‐P and CAL27‐RR cell lines was determined using western blot. β‐Actin was included as an internal loading control. (D) The siGFP‐transfected CAL27‐P, siGFP‐transfected CAL27‐RR, and siFAT1 #2‐transfected CAL27‐RR cells were subjected to a colony‐formation process under radiation doses of 0, 2, 4, 8 Gy. All experiments were performed in triplicate. The two‐way ANOVA test was used to estimate the P value. (CAL27 RR siGFP; ***P = 5.45 × 10⁻⁵ vs. CAL27 P siGFP, **P = 0.0048 vs. CAL27 RR siFAT1). (E) The cells, after radiation exposure, were evaluated for level of foci formation of γ‐H2AX (pS139). The γ‐H2AX (S139) protein levels in CAL27‐P‐siGFP, CAL27‐RR‐siGFP, and CAL27‐RR‐siFAT1 #2 cells, exposed to radiation of 0 or 4 Gy, were determined using western blot. β‐Actin was included as an internal loading control. (F) Cell apoptosis was determined by means of Annexin V‐FITC/PI staining using flow cytometry. CAL27‐P‐siGFP, CAL27‐RR‐siGFP, CAL27‐RR‐siFAT1 #2 cells, treated with radiation of 0 or 4 Gy, were analyzed using an Annexin V‐FITC Apoptosis Detection Kit. Cells were classified as healthy (Annexin V−, PI−), early apoptotic (Annexin V+, PI−), late apoptotic (Annexin V+, PI+), and necrotic (Annexin V−, PI+) cells (upper). Cell death ratio was calculated as the sum of early apoptosis, late apoptosis, and necrosis percentages. All experiments were performed in triplicate. The t‐test was used to estimate the P value. (CAL27 P siGFP in IR 4 Gy; ***P = 8.69 × 10⁻⁵ vs. IR 4 Gy, CAL27 RR siGFP in IR 4 Gy; ***P = 1.16 × 10⁻⁴ vs. CAL27 P siGFP, ***P = 4.81 × 10⁻⁶ vs. CAL27 RR siFAT1). All data have been presented as mean ± SD. The number of asterisks denote the level of statistical significance: **P < 0.01 and ***P < 0.001. HNSCC, head and neck squamous cell carcinoma; GFP, green fluorescent protein; PI, propidium iodide.
