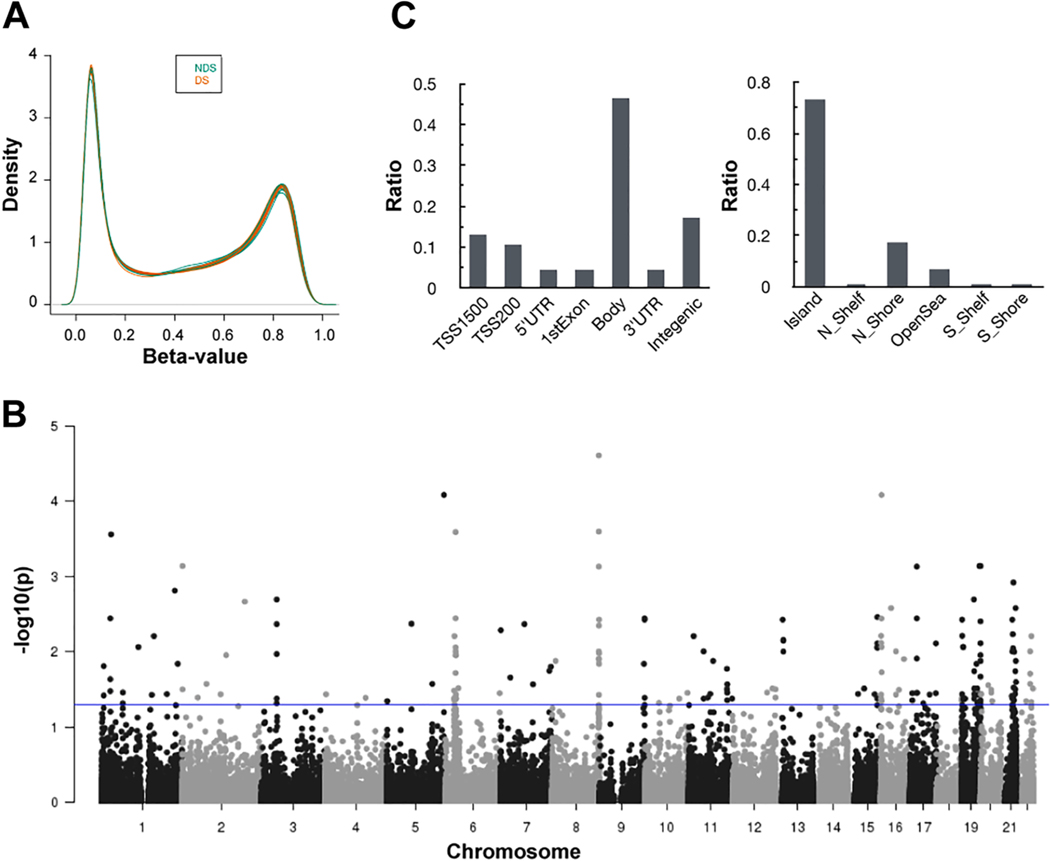
Fig. 1.
Differential methylation in myocardial DNA from donors with DS. A) Density plots of DNA methylation levels (β values) in myocardial DNA from donors with and without DS (DS, n = 12, and non-DS, n = 12). B) P values (-log10) of differentially methylated CpG sites stratified by chromosomal location. The blue line depicts the threshold for statistical significance (FDR = 0.05). C) Location of differentially methylated sites in relation to functional subregions (left panel) and CpG islands (right panel). (For interpretation of the references to colour in this figure legend, the reader is referred to the web version of this article.)

