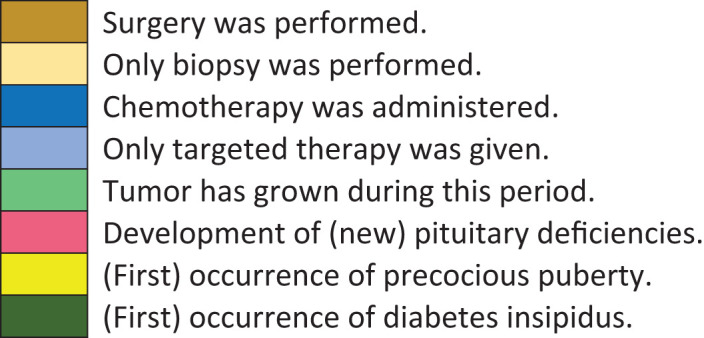
Table 3.
Timeline of events, treatment and pituitary deficiencies in relation to BMI.
| Nr | Age at Dx | Age UW | Sx | CT | TG | Pit def | PP | DI | Age NW | Sx | CT | TG | Pitdef | PP | DI | Age OW | Sx | CT | TG | Pitdef | PP | DI | Age OB |
|---|---|---|---|---|---|---|---|---|---|---|---|---|---|---|---|---|---|---|---|---|---|---|---|
| A | 1.3 | 1.3 | 1.5 | == | 2.7 | == | 7.3 | ||||||||||||||||
| B | 0.5 | 0.5 | 2.0 | == | 4.6 | == | == | 5.1 | |||||||||||||||
| C | 0.4 | 0.4 | B | 1.5 | 2.3 | T | == | 2.5 | |||||||||||||||
| D | 1.6 | 1.2 | ? | 1.6 | 2.2 | * | 2.2 | ||||||||||||||||
| E | 2.1 | 2.5 | B | 3.4 | 4.9 | – | – | – | – | – | – | ||||||||||||
| F | 1.0 | 1.0 | B | 2.2 | 4.9 | == | 5.3 | ||||||||||||||||
| G | 2.9 | 3.0 | ? | 3.3 | ? | 3.9 | 4.5 | ||||||||||||||||
| H | 0.6 | 0.9 | 1.9 | == | 4.4 | == | 4.5 | ||||||||||||||||
| I | 5.5 | 3.8 | – | 5.5 | ? | 12.4 | |||||||||||||||||
| J | 4.5 | 7.0 | ? | 7.5 | ? | 9.8 | ? | 16.0 | |||||||||||||||
| Time during follow-up | |||||||||||||||||||||||

| |||||||||||||||||||||||
B, biopsy only; Dx, diagnosis; CT, chemotherapy; OB, obesity; OW, overweight; Pit. def, pituitary deficiency; PP, precocious puberty; Sx, surgery; T, targeted therapy only; TG, tumor growth; UW, underweight.
Color-filled boxes correspond with occurrence of events during that time period for that child.
Tumor treatment between underweight and normal weight, normal weight and overweight, and overweight and obesity are shown.
None of the children had been given radiotherapy.
==already had pituitary insufficiency, without further development of new insufficiencies.
* developed pituitary deficiency while having obesity.
? no data available.
