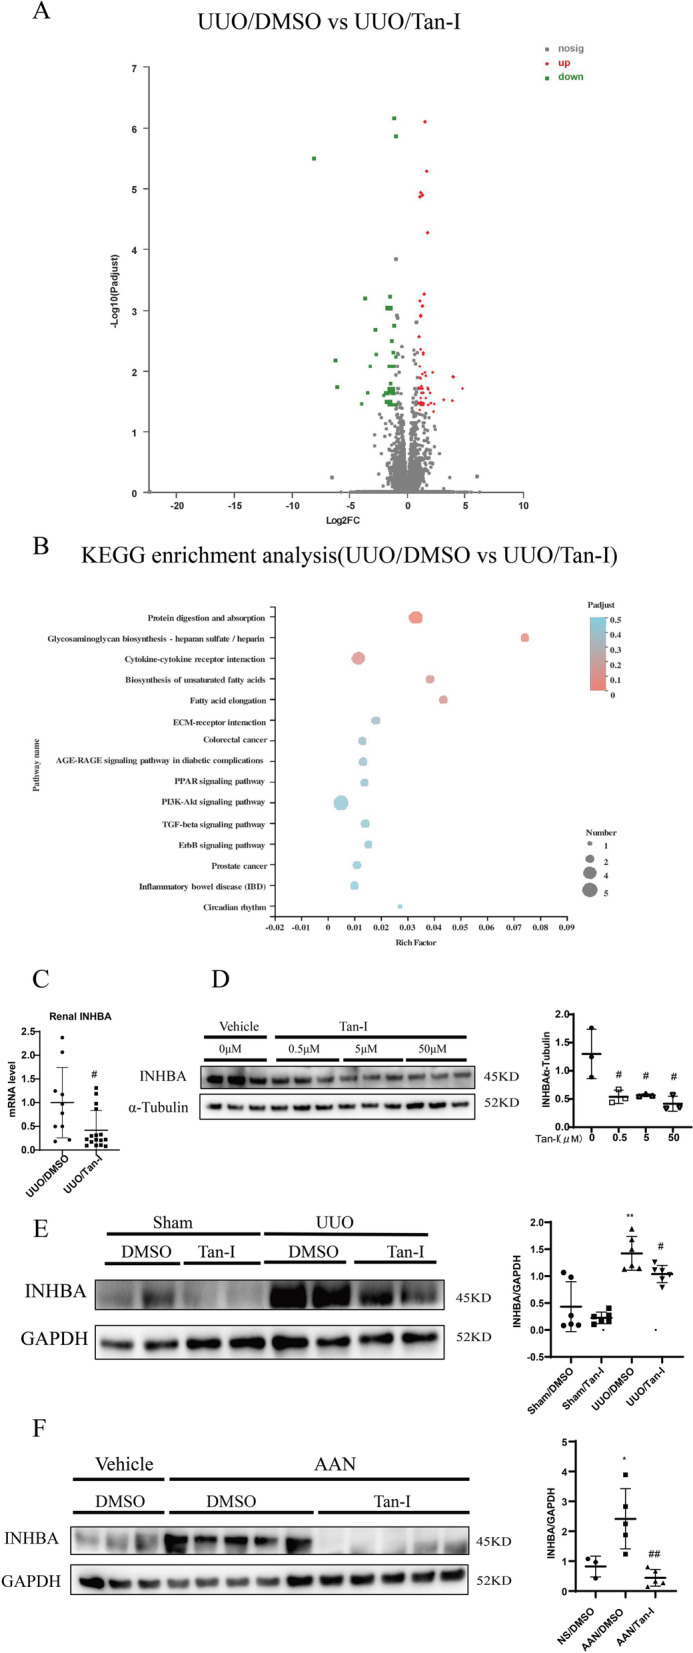
Fig. 4.

Tan-I reduces INHBA expression in vitro and in vivo. A The RNA from DMSO or Tan-I treated UUO kidneys was extracted and analyzed by RNA-Seq. A Volcano profiles of RNA sequence between the two groups was shown. B Kyoto encyclopedia of genes and genomes (KEGG) pathway analysis of differential expressed genes between two groups was performed [38–40]. C Quantitative PCR analysis of INHBA expression in UUO kidneys treated with DMSO or Tan-I. N = 8–11 in each experimental group and one representative of at least three independent experiments is shown. Data represents mean ± SD. # p < 0.05 vs UUO/DMSO. D NRK-49F cells were starved for 24 h and followed by 24 h treatment with different concentration (0.5 μM, 5 μM, 50 μM) of Tan-I. The expression of inhibin beta-A (INHBA) was analyzed by Western blotting and then quantified. Data represents mean ± SD. #p < 0.05 vs DMSO. ##p < 0.01 vs DMSO. N = 9 in each experimental group and one representative result of at least three independent experiments is shown. E The expression of INHBA in sham or UUO kidneys was analyzed by Western blotting and then quantified. Data represents mean ± SD. *p < 0.05 vs. Sham/DMSO. ##p < 0.01 vs UUO/DMSO. N = 8–11 in each experimental group and one representative of at least three independent experiments is shown. F The expression of INHBA in NS or AAN kidneys was analyzed by Western blotting and then quantified. Data represents mean ± SD. *p < 0.05 vs NS/DMSO. ##p < 0.01 vs AAN/DMSO. N = 8 in each experimental group and one representative of at least three independent experiments is shown. Full-length blots are presented in Supplementary Fig. 4
