Fig. 1.
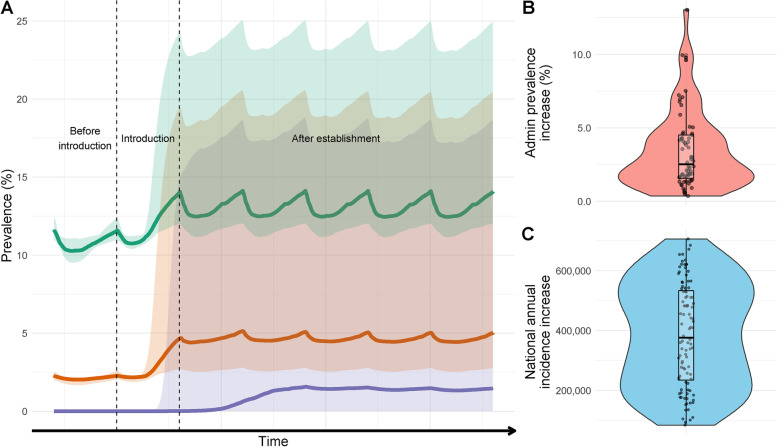
The impact of A. stephensi introduction on malaria prevalence and incidence in areas of Ethiopia in areas under 2000m and identified to be suitable. A Changes in prevalence following introduction and establishment of A. stephensi in 3 areas of malaria transmission in Ethiopia. Vertical dashed lines span the period in which A. stephensi is introduced and coloured shapes the 95% CIs. Green represents a transmission scenario of ~12% prevalence, orange, 2.5% and purple <0.1%. The time scale on the x-axis is deliberately omitted as the rate of invasion is highly uncertain. Prevalence fluctuating due to pre-existing and ongoing mass distribution of ITNs. B The median difference of P. falciparum prevalence following establishment in the different administrative groupings which have been predicted to be suitable based on Sinka et al. (2020) and under 2000m. C The annual increase in clinical incidence of malaria caused by P. falciparum nationally. Individual dots show uncertainty in predictions given differences in mosquito bionomics (for 100 samples of the Latin hyper cube). Periodicity is caused by ongoing distribution of ITNs and IRS which are assumed to continue at pre-invasion levels. For Fig. 1B, C there is no x-axis, and points are jittered for visualisation purposes and to aid ease of interpretation rather than to connote a certain value

