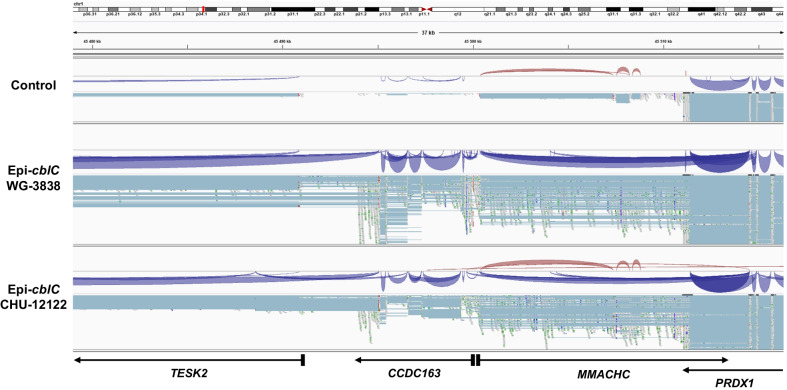
Fig. 5.
Overview of the transcription anomalies with aberrant splicing and wrong splice junction usage in the genomic region encompassing TESK2, CCDC163, MMACHC, and PRDX1. For every three samples, two tracks are represented: i) a sashimi plot with splice junction usage (thickness of the line is proportional to read depth supporting the splice junctions; in red: forward strand processing; in blue: reverse strand processing), and ii) an exhaustive read coverage in squished mode, with horizontal blue-grey lines indicating inserts between paired-end reads; In this view, well-defined horizontal gaps represent exons when introns are successfully spliced. Alignment was made with HISAT2 on the reference genome hg38

