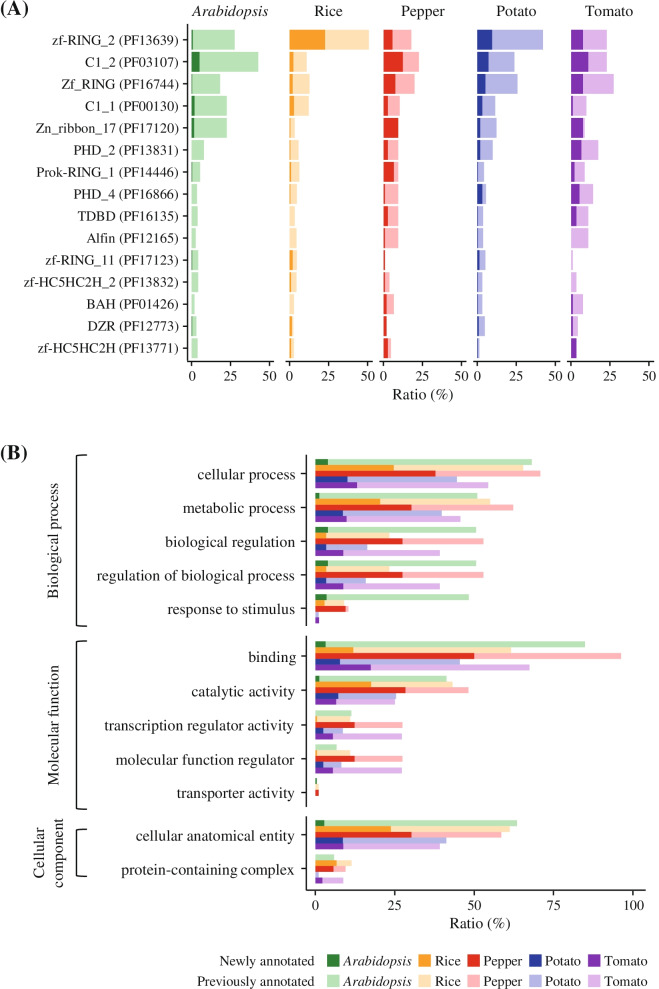
Fig. 1.
Characterization of the PHD-finger gene family in five plant species. A, B The proportion of PHD-finger genes for each species is shown in different colors. The proportion of newly identified PHD-finger genes is shown in opaque colors. A Integrated domain repertoires of PHD-finger genes. The portion of PHD-finger genes that contained the top 15 integrated domains (IDs) is shown in the bar plot. B Distribution of gene ontology (GO) terms of PHD-finger genes. The three main GO categories are listed on the left side of the bar plot. The top five GO terms in each category are shown in bar plot

