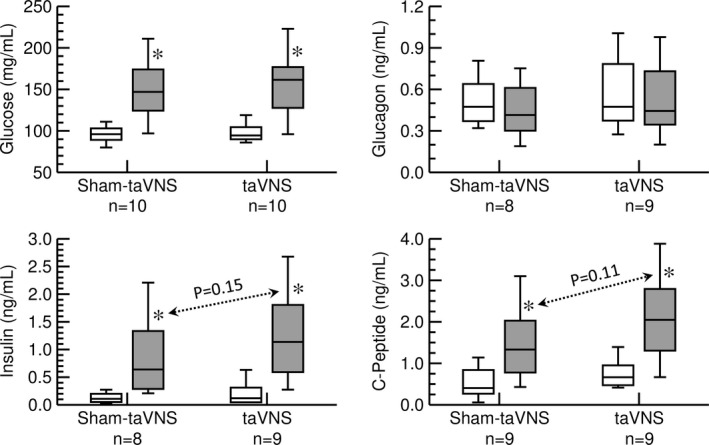
FIGURE 3.

Effects of sham‐taVNS and taVNS on concentrations of blood glucose (top left), plasma glucagon (top right), plasma insulin (bottom left), and plasma C‐peptide (bottom right) in response to ingestion of a high‐calorie beverage (second protocol). Concentrations before (white columns) and after (grey columns) the taVNS or sham‐taVNS interventions are shown. Data are presented as box‐whisker plots (median, upper/lower quartile, upper/lower extreme). *: p < 0.05 before versus after intervention (paired t‐test)
