
FIGURE 4.
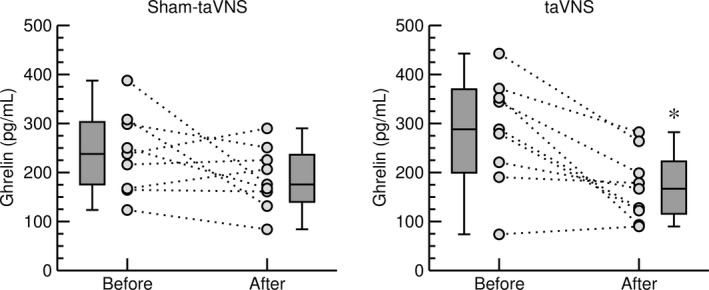
Effects of sham‐taVNS (left) and taVNS (right) on plasma ghrelin concentration in response to ingestion of a high‐calorie beverage (second protocol). Data obtained before and after taVNS or sham‐taVNS are shown for individual study participants (grey circles, n = 9) and as box‐whisker plots (median, upper/lower quartile, upper/lower extreme). *: p < 0.05 after versus before taVNS (paired t‐test)