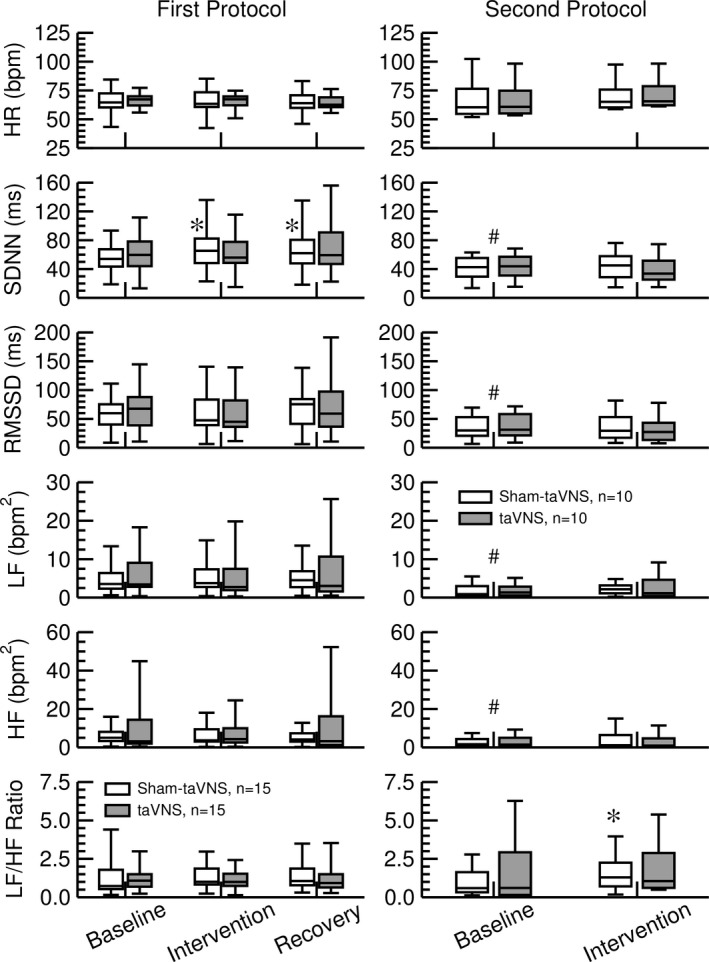
FIGURE 5.

Effect of sham‐taVNS (white bars) and taVNS (grey bars) on heart rate (HR), time‐domain heart rate variability (HRV) parameters standard deviation of NN intervals (SDNN) and root mean square of successive RR interval differences (RMSSD), and frequency‐domain HRV parameters low‐frequency spectral power (LF), high‐frequency spectral power (HF), and LF to HF ratio. The left column shows HR and HRV parameters obtained in the first protocol (n = 15) and the right column shows HR and HRV parameters obtained in response to a high‐calorie beverage (second protocol, n = 10). Baseline data were obtained during the recording that preceded the taVNS or sham‐taVNS intervention. Intervention data were obtained during the application of taVNS or sham‐taVNS. Recovery data were only recorded in the first protocol and were obtained following the taVNS or sham‐taVNS intervention as illustrated in Figure 1. Data are presented as box‐whisker plots (median, upper/lower quartile, upper/lower extreme). *: p < 0.05 versus baseline (1‐way ANOVA with post‐hoc Scheffé test in protocol 1; paired t‐test in protocol 2). #: p < 0.05 baseline values of second protocol versus baseline values of first protocol (unpaired t‐test)
