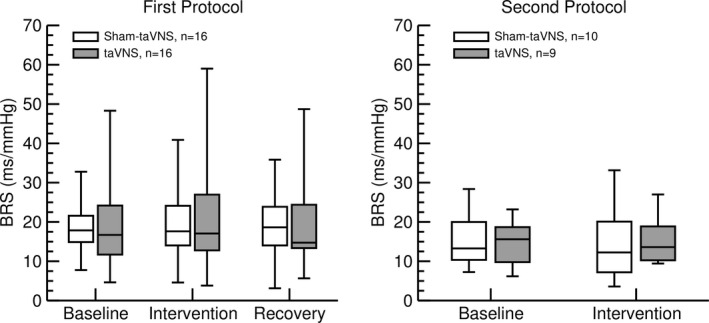
FIGURE 6.

Effects of sham‐taVNS (white bars) and taVNS (grey bars) on baroreceptor‐heart rate reflex sensitivity (BRS) in the first protocol (left) and in response to a high‐calorie beverage (second protocol, right). No significant differences from baseline values were observed during the taVNS or sham‐taVNS interventions (both protocols) or during the recovery recording following the interventions (first protocol only). Data are presented as box‐whisker plots (median, upper/lower quartile, upper/lower extreme)
