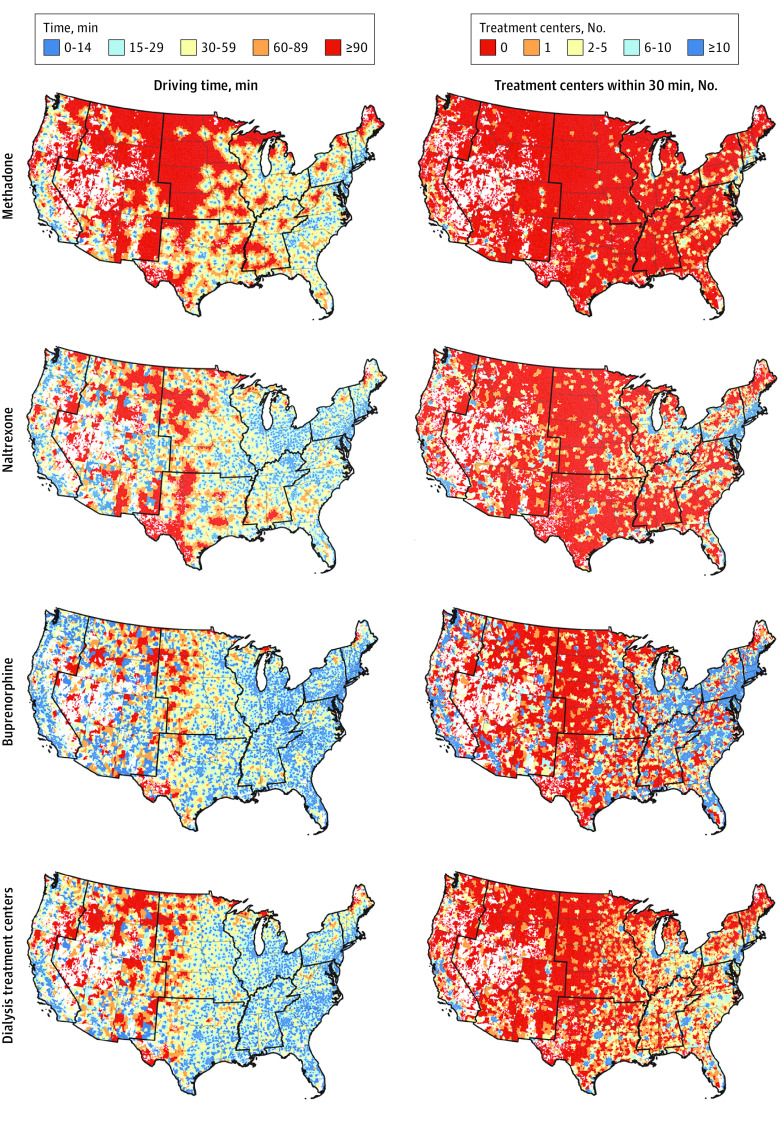
Figure 1. Geographic Access to Treatment Locations Among Zip Codes Within the Continental United States in 2020.
Drive time represents the time in minutes from the population weighted center of the zip code tabulation area to the zip code tabulation area of the nearest treatment location for each treatment type. Count within 30 minutes represents the number of treatment locations within a 30-minute drive of a zip code tabulation area. Unpopulated large land areas, such as national parks or large water bodies, are not assigned to a ZCTA, and these gaps are shown in white.

