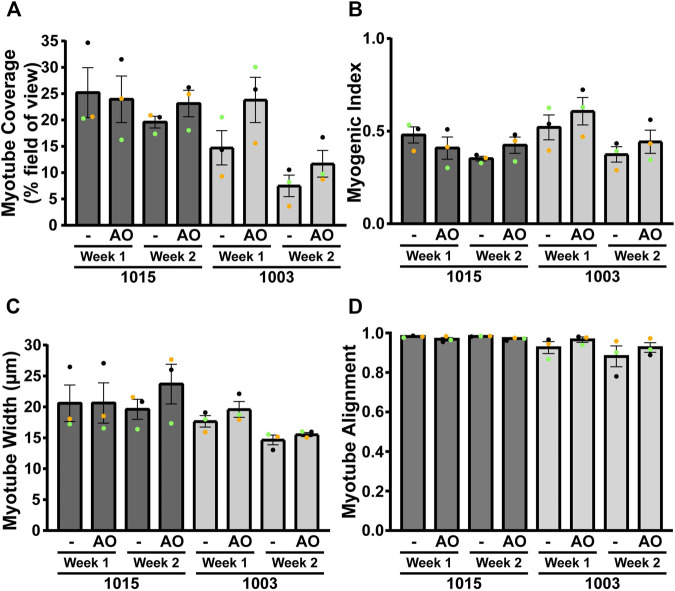
FIGURE 8.
Morphological quantification of AO-treated DMD 1015 and DMD 1003 iDRMs. Different parameters were measured for each cell line using α-actinin staining: (A) α-actinin area coverage per field of view; (B) myogenic index representing the proportion of nuclei in myotubes (containing at least three nuclei); (C) minor axis length as a proxy for myotube width; and (D) myotube alignment. Bars represent SEM. Each experiment (n = 3) is represented by different color dots.

