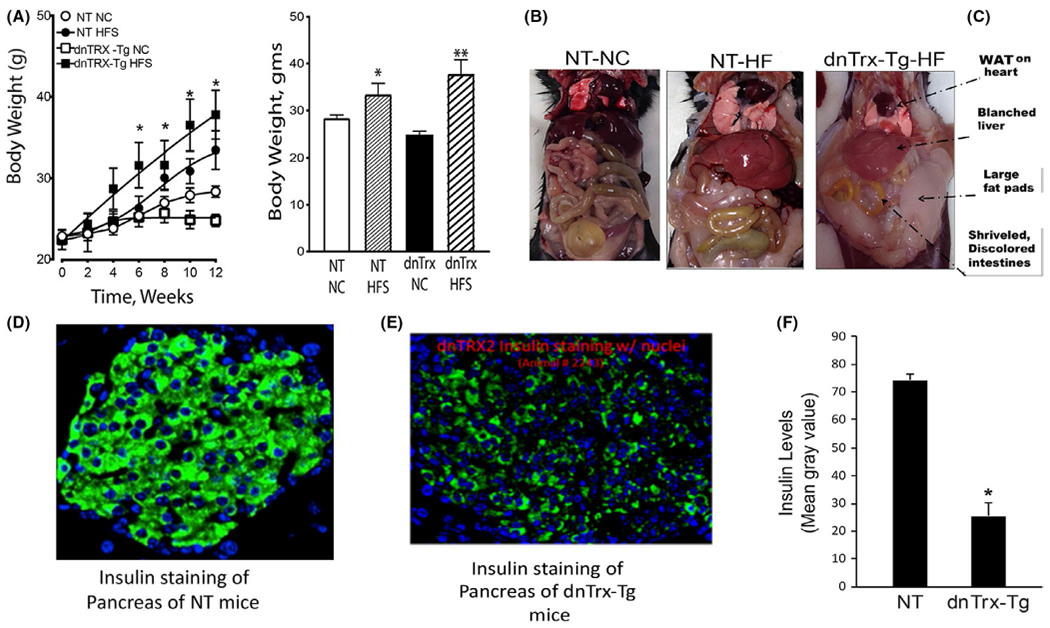
FIGURE 1.

(A) dnTrx-Tg mice on HFS gained significant weight compared to NT-HFS mice: Mice were fed as mentioned in the methods. Body weight of NT-NC mice (open circle), NT-HFS (closed circle), dnTrx-Tg-NC mice (open square), and dnTrx-Tg-HFS(closed square). Values are -presented as standard error of mean (SEM). n = 6, *p < .05, NT-HFS vs. NT-NC; dnTrx-HFS vs. dnTrx-chow. (B) Final body weight of all mice groups after 12 weeks. Mice were fed similar to that described in (A). n = 6 *p < .05, NT-HFS vs. NT-NC, dnTrx-HFS vs. NT-HFS; p < .01, dnTrx-HFS vs. dnTrx-NC. (C) Visceral morphology of NT-NC, NT-HFS, and dnTrx-HFS mice; (D) Immunofluorescence staining of section of pancreas of NT and (E) dnTrx-Tg mice demonstrating the insulin levels; (F) gray scale signal intensity of NT and dnTrx-Tg mice for insulin, *p < .05 (Student’s t test), N = 3 (males and females)
