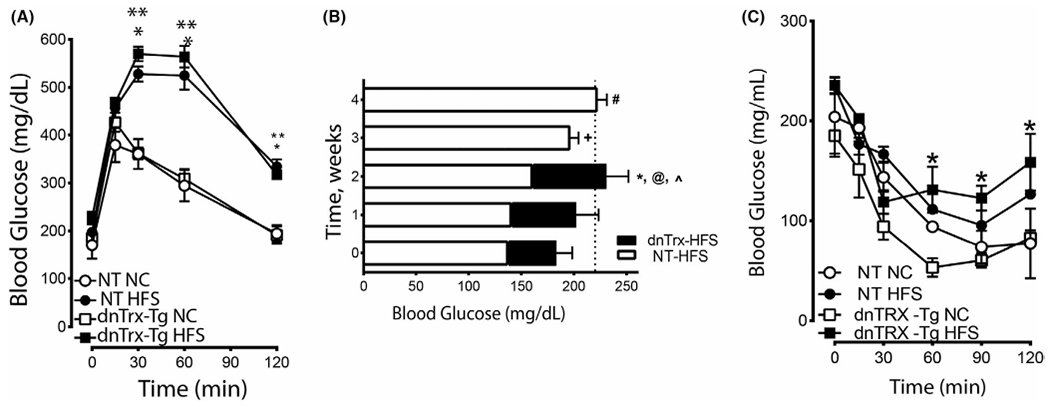
FIGURE 2.

Loss of redox-active Trx accelerates T2D phenotype in response to HFS diet: (A) Glucose tolerance test: Mice were fed NC diet or HFS diet as described in the methods. Blood glucose levels of mice were measured after they were injected with glucose as described in the methods. NT-NC (open circle), NT-HFS (closed circle), dnTrx-NC (open square), and dnTrx-HFS(closed square) were injected with glucose. Values are -presented as standard error of mean (SEM); (B) Blood glucose levels in NT or dnTrx-Tg mice in HFS diet. NT or dnTrx-Tg mice (n = 6) were on HFS for 4 weeks. Blood glucose levels were measured each week for 4 weeks. *, @, ^ p < .05 dnTrx at 2 weeks vs. NT-HFS. (C) Insulin tolerance test: Blood glucose levels of mice after being injected with insulin as described in the methods in NT-NC, NT-HFS, dnTrx-Tg-NC and dnTrx-Tg-HFS mice. Values are -presented as standard error of mean (SEM). (n = 6, males and females) p < .05, (*) dnTrx-HFS vs. dntrx-chow at time points 60, 90 and 120 min
