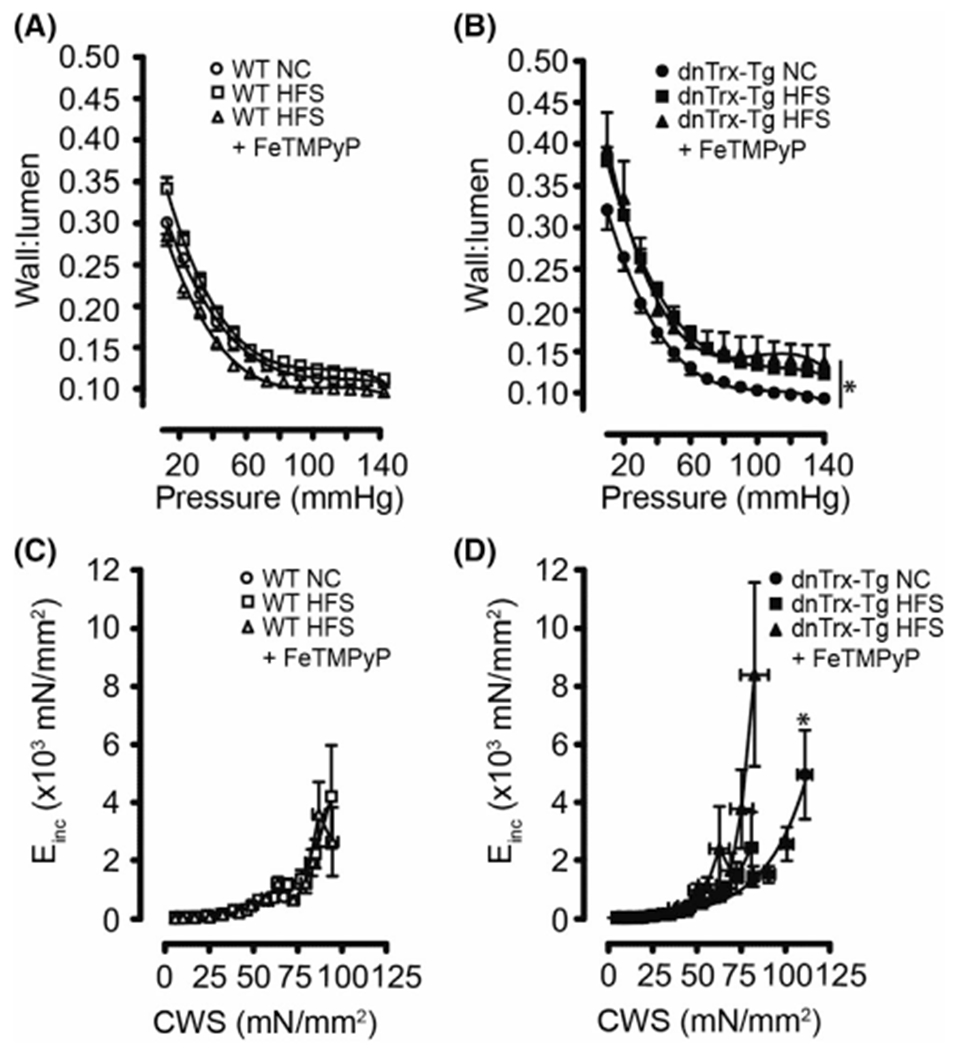
FIGURE 5.

Passive wall-to-lumen ratios and elasticity of small mesenteric arteries (A–D): Passive (0 mM CaCl2 + 10 μM SNP + 2.5 mM EGTA) wall-to-lumen curves (A and B) and circumferential wall stress (CWS) versus incremental elastic modulus (Einc) curves (C and D) for pressurized 2nd-order mesenteric arteries isolated from NT (A and C) and dnTrx-Tg (B and D) mice fed a normal chow (NC) diet (circles), high fat/high sucrose (HFS) diet (squares), and HFS followed by tail vein injection of the ONOO− decomposition compound FeTMPyP (triangles). Values are shown as means ± SEM. *p < .05 versus NC. Number of mice (n = 7, males, and females)
