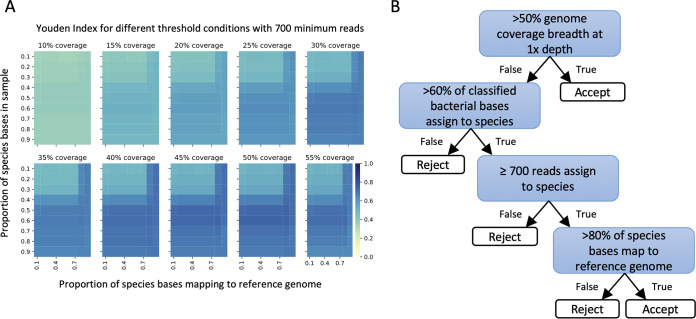
FIG 2.
Species detection. Heat map of Youden index (sensitivity + specificity – 1) values at 700 minimum reads per species for each coverage breadth (panels), with proportion of species bases in the sample (y axis) over the proportion of these bases that map to a reference genome (x axis). Color represents Youden index, where darker blue indicates a more optimal threshold condition (A). Final filtering selection criteria used to determine true presence of a species from metagenomic sequencing reads (B).

