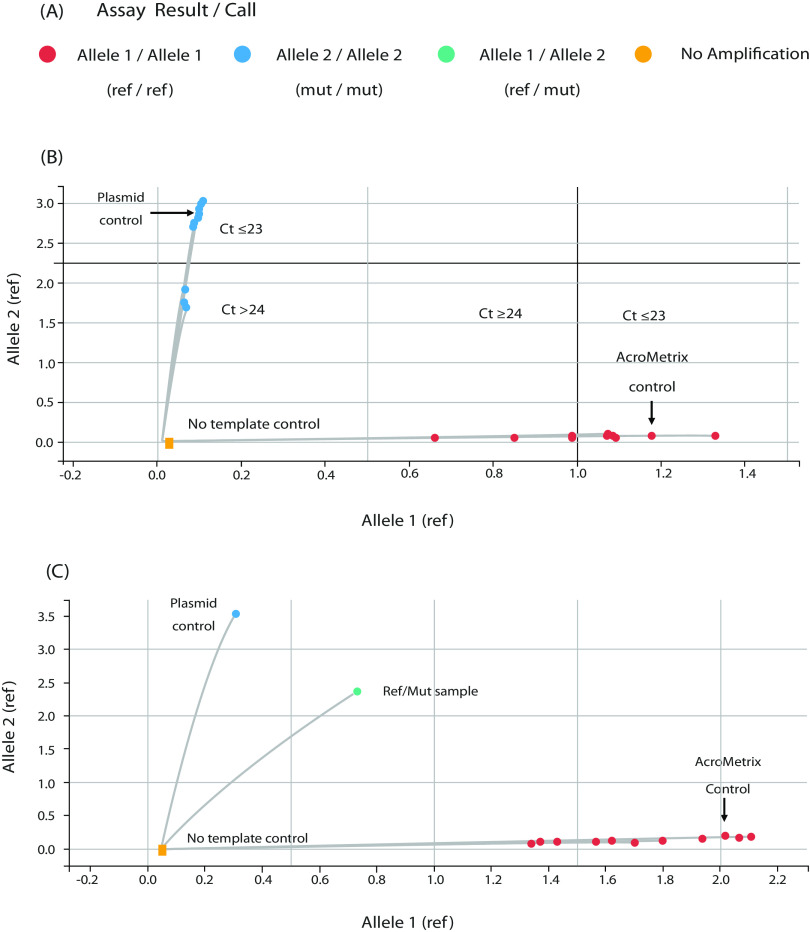
FIG 3.
Mutation assay results viewed using QuantStudio Design and Analysis software with the genotyping analysis module. (A) Assay results are “called” in 4 colors according to their outcome. Red indicates allele 1/allele 1 (ref/ref) for WT, blue indicates allele 2/allele 2 (mut/mut) for mutation present, green refers to allele 1/allele 2 (ref/mut), and orange means that results show no amplification. (B) Allelic discrimination plot showing clear discrimination between wild-type (WT) samples (red dots along the x axis) and the mutation samples (blue dots along the y axis) with high and low viral loads. (C) Allelic discrimination plot showing an example of a ref/mut sample (green dots). CT, cycle threshold. Cutoffs are determined by the QuantStudio Design and Analysis software.

