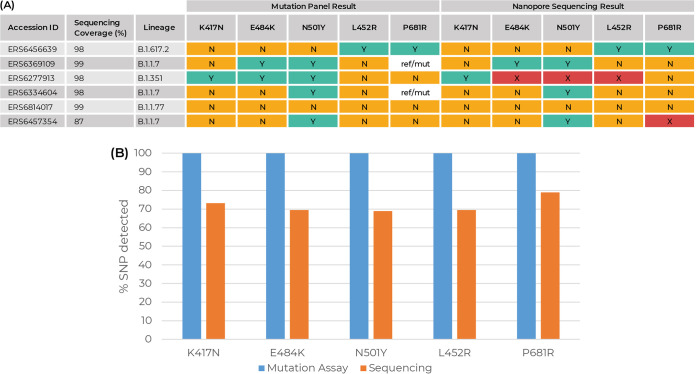
FIG 5.
(A) Example of mutation assay results compared with Nanopore sequencing results from a selection of samples run through the assay. All results for all samples run are included in Data Set S1 in the supplemental material. Orange square “N,” mutation not present; green square “Y,” mutation present; white “ref/mut,” mutation present on one allele only. The red square “X” indicates that there was not sufficient coverage of that SNP after sequencing. (B) Percent comparison results of all mutation assay results and corresponding Nanopore sequencing data. Blue bars (mutation assay), percent (%) SNP agreement compared to the corresponding sequencing data. Orange bars (sequencing), percent SNPs identified when sequencing data for each sample were assigned a lineage by Pangolin.

