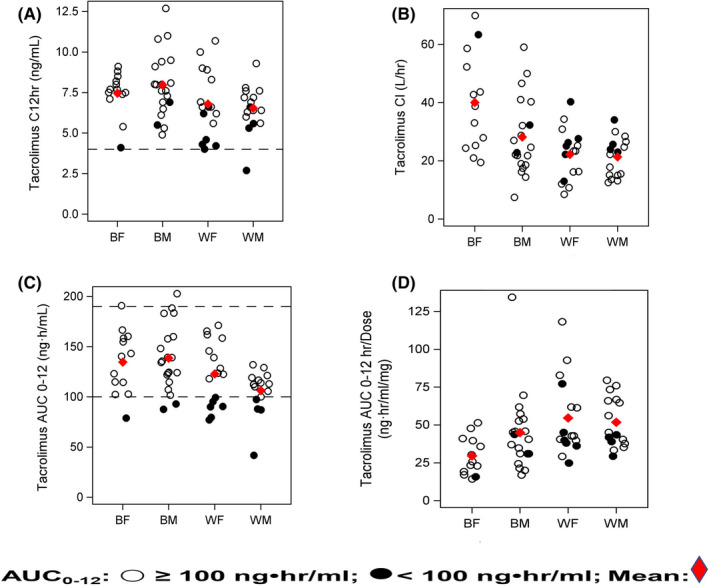
FIGURE 3.

Panels A–D: Select tacrolimus pharmacokinetic parameters stratified by race‐sex groups and target AUC0–12 [Open dot represents AUC0–12 ≥100 ng‧h/ml; closed dot represents AUC0–12 <100 ng‧h/ml]: Panel A represents 12‐h concentration (Race: p = 0.021) achieved in each patient using the range of 4 (dotted line) to 12 ng/ml. Panel B depicts tacrolimus Cl for each group. Rapid Cl (Race: <0.001; Sex: p = 0.066; Race × Sex: p = 0.085) are noted in Black females and males compared to White recipients. Panel C depicts tacrolimus AUC0–12 relative to race and sex groups (Race: p = 0.005) using the tacrolimus therapeutic AUC0–12 guide of ≥100 ng‧h/ml, represented by the dotted line and less than or equal to 190 ng‧h/ml. 7 , 8 There were 68.8% (22/32) of White and 84.5% (28/33) of Black patients within the target AUC0–12 guide of 100–190 ng‧h/ml for recipients >1‐year post‐transplant. Note that the tacrolimus AUC0–12 was <100 ng‧h/ml in 31.3% of Whites and 9.1% of Blacks. Panel D presents the distribution of dose‐normalized AUC0–12 between race and sex groups (Race: <0.001; Sex: p = 0.084; Race × Sex: p = 0.068). See Results section and Table S2 for comparisons between tacrolimus AUC0–12 exposures < and ≥100 ng‧h/ml (p = 0.027). AUC0–12, area under the concentration time curve 0–12 h; BF, Black females; BM, Black males; C 12 h, 12‐h trough concentration; Cl, clearance; WF, White females; WM: White males
