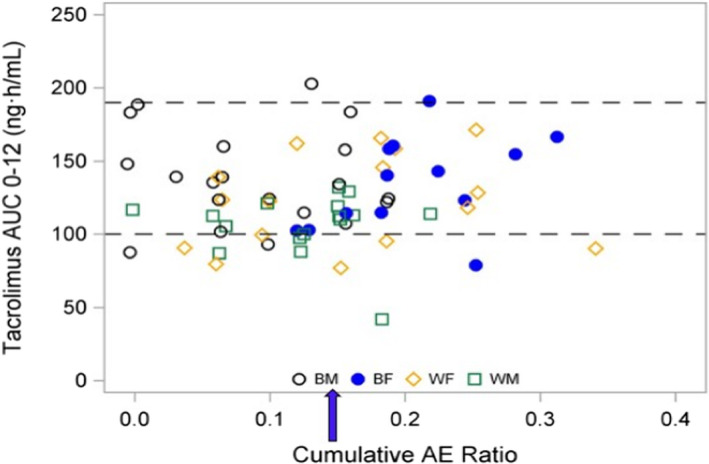
FIGURE 4.

Tacrolimus AUC0–12 and relationship to cumulative AE ratio. This graph depicts the target tacrolimus AUC0–12 guide ranging from ≥100 to ≤190 ng‧h/ml represented by dotted lines from consensus recommendations 7 , 8 and the relationship to the cumulative adverse effect (AE) ratio for each patient stratified by race and sex. The ratio of 0.14 (blue arrow) was selected since it represents consistent and significant manifestation of cumulative adverse effects. 46 Note that 69% of the White and Black female recipients exhibited a cumulative adverse effect ratio ≥0.14 with a mean (SD) of 0.222 (0.049) indicating more severe adverse effects for women who were within or below the therapeutic tacrolimus AUC0–12 h. In contrast, 39% of males had a cumulative adverse effect ratio of 0.167 (0.019) at the time of study. AE, adverse effects; AUC0–12, area under the concentration time curve 0–12 h; BF, Black females [blue closed circle]; BM, Black males [black open circle]; WF, White females [yellow diamond]; WM, White males [green square]
