
Fig. 4. Relationship between mean brain activity in the entorhinal cortex and the effect of disease group differences in threshold on odorant detection (A) and identification (B).
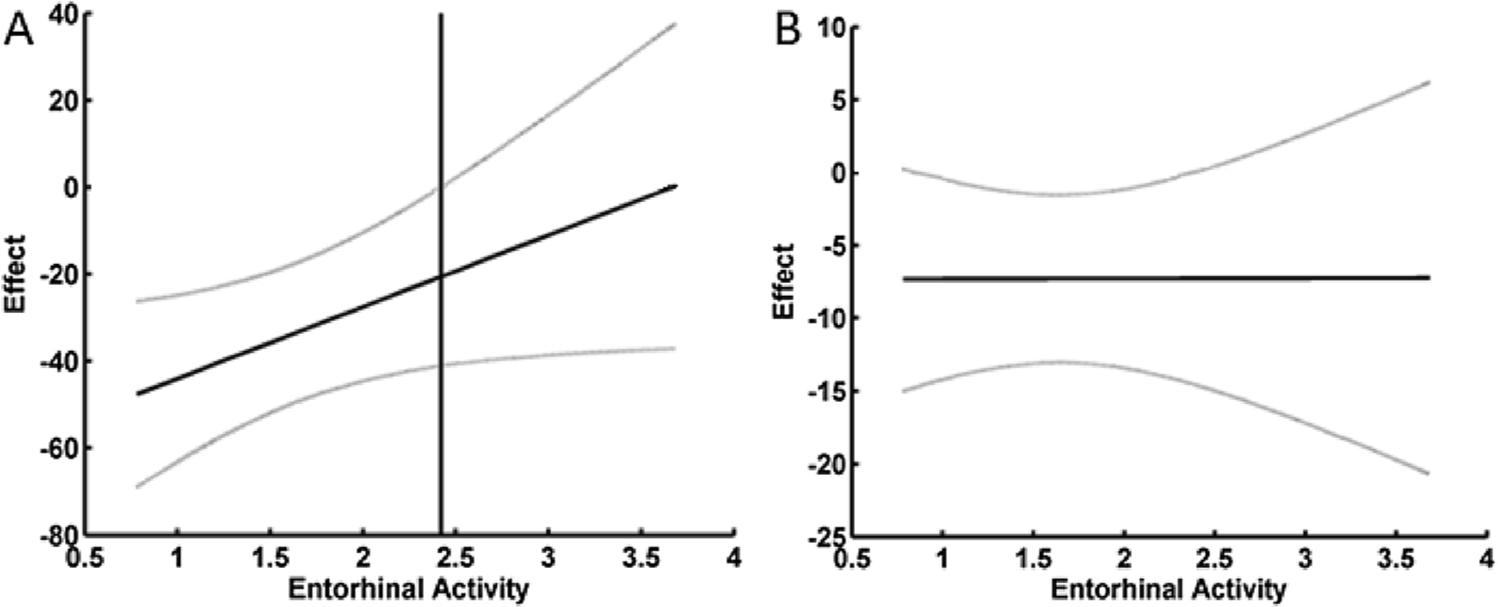
Notes: A) For odor detection there was a significant interaction between brain activity and threshold in predicting odorant detection. The vertical line is the point above which increasing brain activity renders the effect that disease-related differences in threshold have on detection non-significant at p < 0.05. This Z-value of 2.42 was calculated using the Johnson-Neyman technique for probing the interaction. B) For odorant identification there was no significant interaction between brain activity and threshold in predicting odorant identification. The grey lines are the 95 % confidence intervals around the moderated effect.