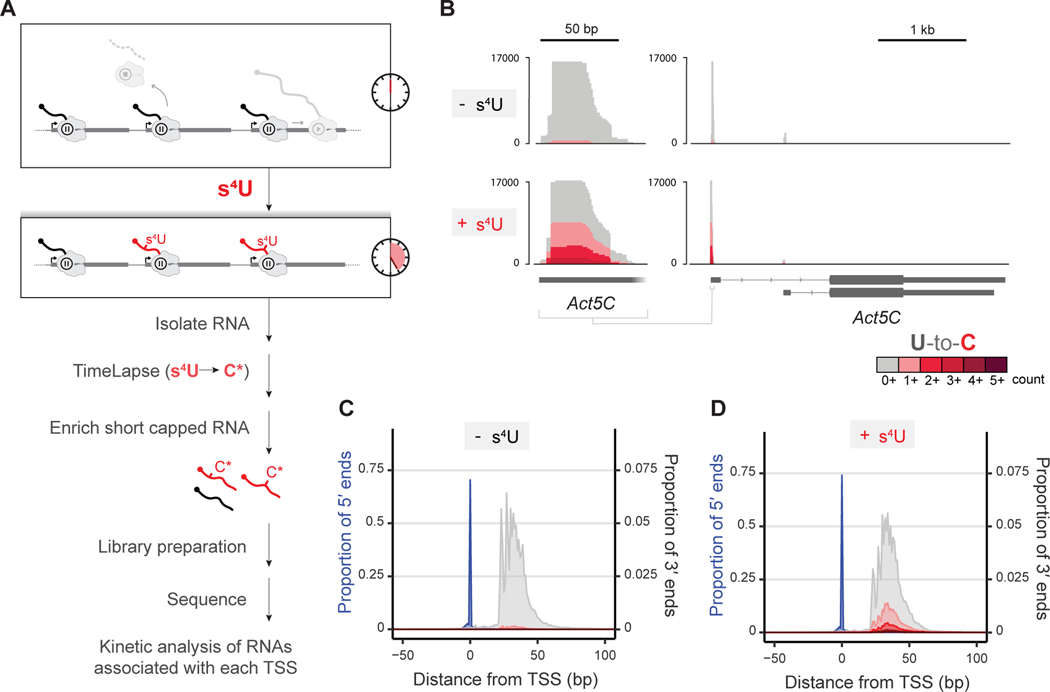
Figure 1. STL-seq captures turnover dynamics of transcripts from promoter-proximal paused polymerase.
(A) Scheme of STL-seq. Native RNA is metabolically labeled with s4U for a short time before isolating RNA. TimeLapse chemistry is performed prior to enriching for short, capped RNA transcripts which are then sequenced.
(B) Example STL-seq tracks demonstrating typical Start-seq coverage with elevated T-to-C TimeLapse mutations only in s4U-labeled samples. The entire Act5C locus is shown (right) with an expanded view of the major TSS (left).
(C and D) Metaplots of STL-seq 5´ and 3´ read ends identify the TSS and promoter-proximal pause site relative to the observed TSS location. The single nucleotide location of the TSS (blue, 5´ end of read) and pausing position (grey and red, 3´ end of read) are depicted separately. The 3´ ends are colored by the read’s mutational content while the 5´ ends are not. Read ends at each distance from the TSS for the unlabeled (C) and labeled (D) samples are shown as a proportion of the total number of reads. The proportion of 5´ ends corresponds to the left y-axis scale and the proportion of 3´ ends corresponds to the right y-axis scale.

