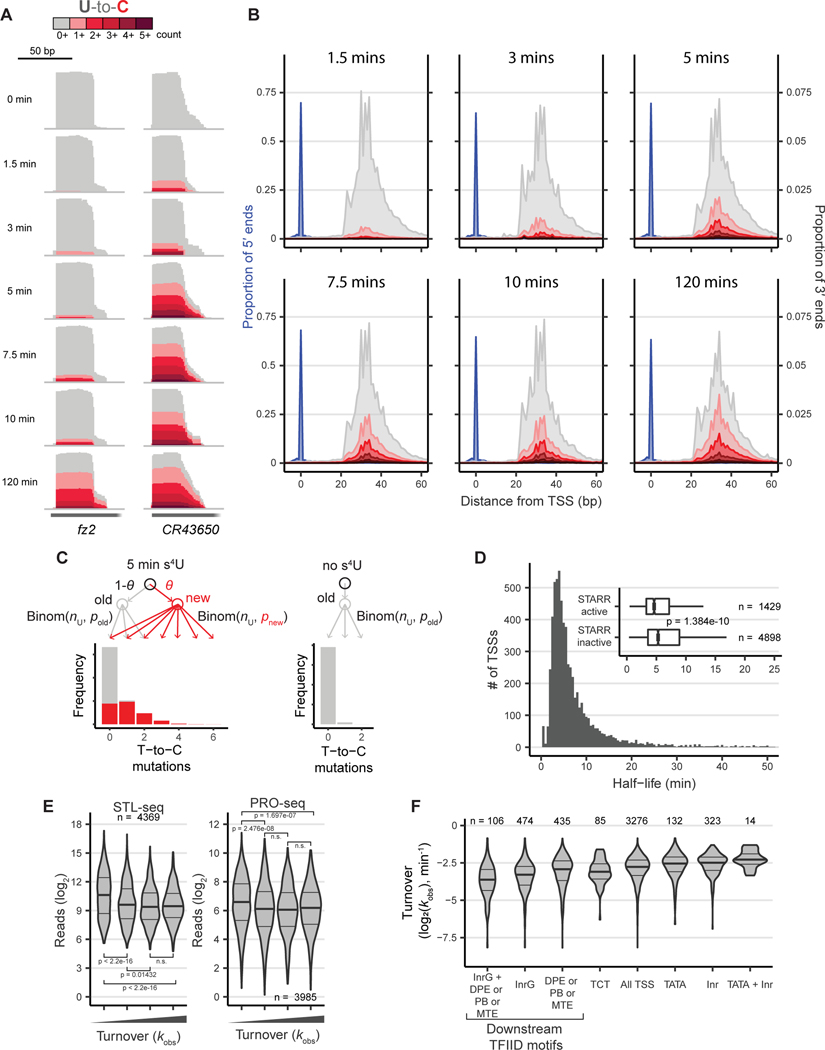
Figure 2. Estimation of scRNA transcript turnover from STL-seq.
(A) STL-seq tracks of the fz2 and CR43650 TSSs labeled with s4U for the indicated times. Tracks are autoscaled to show relative proportion of mutated reads.
(B) Metaplots of STL-seq 5´ (blue) and 3´ (grey and red) read ends relative to the TSS labeled with s4U for the indicated times with similar presentation to Figure 1C&D.
(C) The fraction of new scRNA (θ) is estimated with a mixed binomial model. The model estimates the background mutation rate (pold) with the unlabeled control and uses the number of U’s in each read (nU) and the distribution of T-to-C mutations in the labeled samples to estimate the TimeLapse-dependent mutation rate (pnew). In this simulated example, each read derives from a TSS with a 5 min half-life and average read length of 35 nt with a uridine every 4 nts. Newly synthesized transcripts (red) are synthesized with pnew = 10% and preexisting reads (grey) are synthesized with pold = 0.25%. See STAR methods for more details.
(D) Histogram of scRNA half-life estimates made with STL-seq from S2 cells. The inset boxplot separates scRNA half-lives into those aligned to regions with and without STARR-seq enhancer activity. Significance was assessed by a two-sided Wilcoxon rank sum test.
(E) The distribution of either STL-seq reads (left) or promoter-proximal PRO-seq reads (right, Elrod et al., 2019) grouped into even quartiles by observed scRNA turnover. Significance was assessed by a two-sided Wilcoxon rank sum test.
(F) Distribution of the total observed turnover rate constant at promoters grouped by motif content. All motifs are known TFIID binding elements except the polypyrimidine initiator (TCT) and the degenerate initiator (Inr). The pause button (PB), downstream promoter element (DPE), and motif ten element (MTE) were grouped together such that promoters may have one or a combination of these within 50 bp downstream.

