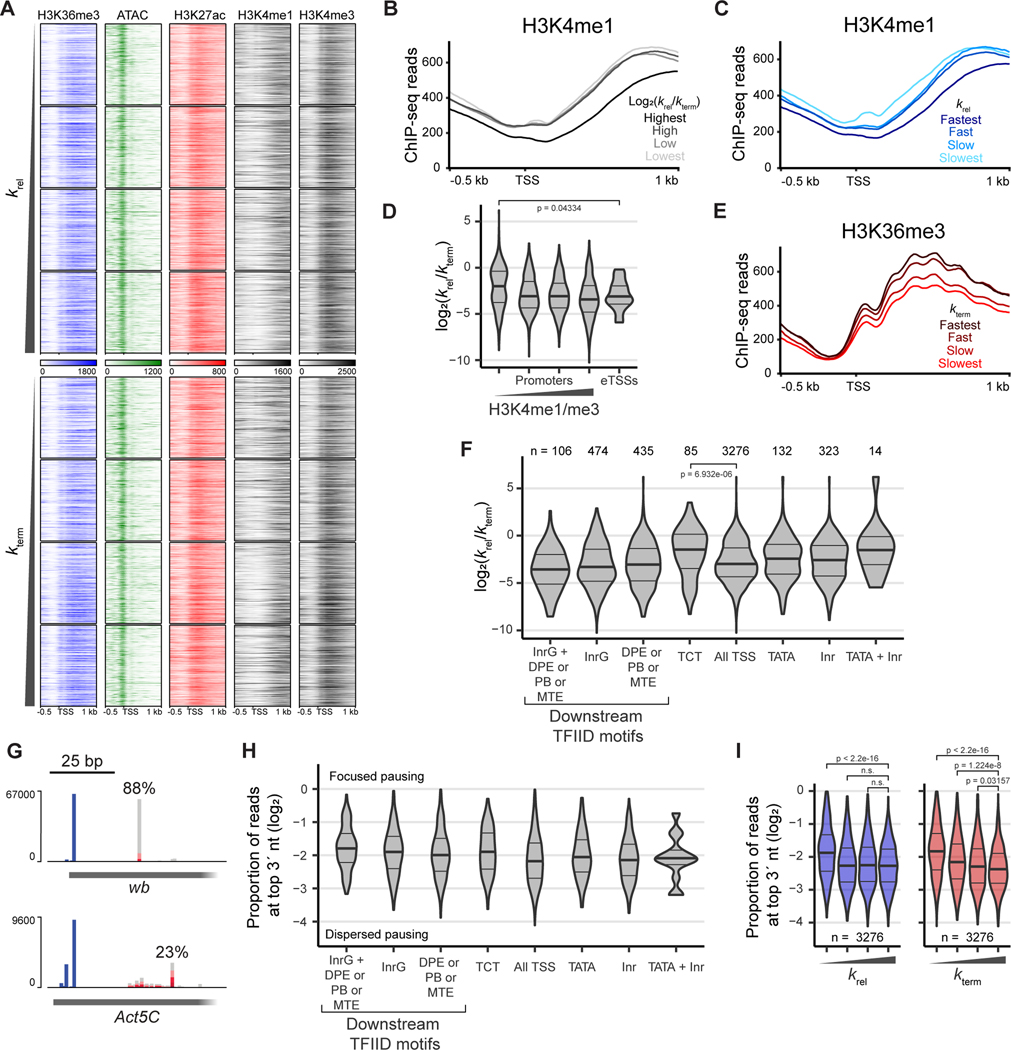
Figure 4. Weak promoter architecture leads to rapid termination of paused Pol II.
(A) Heat maps of ATAC-seq (Elrod et al., 2019) and H3K27ac, H3K4me1, H3K4me3 (Henriques et al., 2018), and H3K36me3 (Chen et al., 2012) ChIP-seq around promoters grouped into even quartiles and order by pause release and termination at the respective TSS. Heatmaps are centered on the STL-seq TSS with a window of 0.5 kb upstream and 1 kb downstream.
(B) Metaplot of H3K4me1 ChIP-seq data around promoters with a window of 0.5 kb upstream and 1 kb downstream of the TSS grouped into even quartiles by the log2 ratio of the pause-release rate to the termination rate (n = 3270 promoters).
(C) Metaplot of H3K4me1 ChIP-seq data around promoters with a window of 0.5 kb upstream and 1 kb downstream of the TSS grouped into even quartiles by pause release (n = 3270 promoters).
(D) Distribution of the log2 ratio of the release rate to the termination rate at promoters grouped by whether TSSs are of high confidence promoters or enhancers (eTSSs, n = 21). Promoters are further grouped into even quartiles by H3K4me1 enrichment determined by ChIP-seq. Significance was assessed by a two-sided Wilcoxon rank sum test.
(E) Metaplot of H3K36me3 ChIP-seq data around promoters with a window of 0.5 kb upstream and 1 kb downstream of the TSS grouped into even quartiles by termination (n = 3270 promoters).
(F) Distribution of the log2 ratio of the release rate to the termination rate at promoters grouped by motif content. The pause button (PB), downstream promoter element (DPE), and motif ten element (MTE) were grouped together such that promoters may have one or a combination of these in the downstream region. Significance was assessed by a two-sided Wilcoxon rank sum test.
(G) Example STL-seq tracks where the single nucleotide location of the TSS (blue, 5´ end of read) and pausing position (grey and red, 3´ end of read) are depicted separately. The 3´ ends are colored by the read’s mutational content while the 5´ ends are not. The maximum percent of reads with the same 3´ end is shown above the read position.
(H) Distribution of the proportion of reads with 3´ ends located at the most frequent pause position. At each promoter, the most common position of the 3´ read end was identified, and the proportion of reads at this position was determined. Promoters are separated by promoter motif as in F.
(I) Distribution of the proportion of reads with 3´ ends located at the most frequent pause position as in H but promoters are grouped into even quartiles by pause release (left) or termination (right). Significance was assessed by a two-sided Wilcoxon rank sum test.

