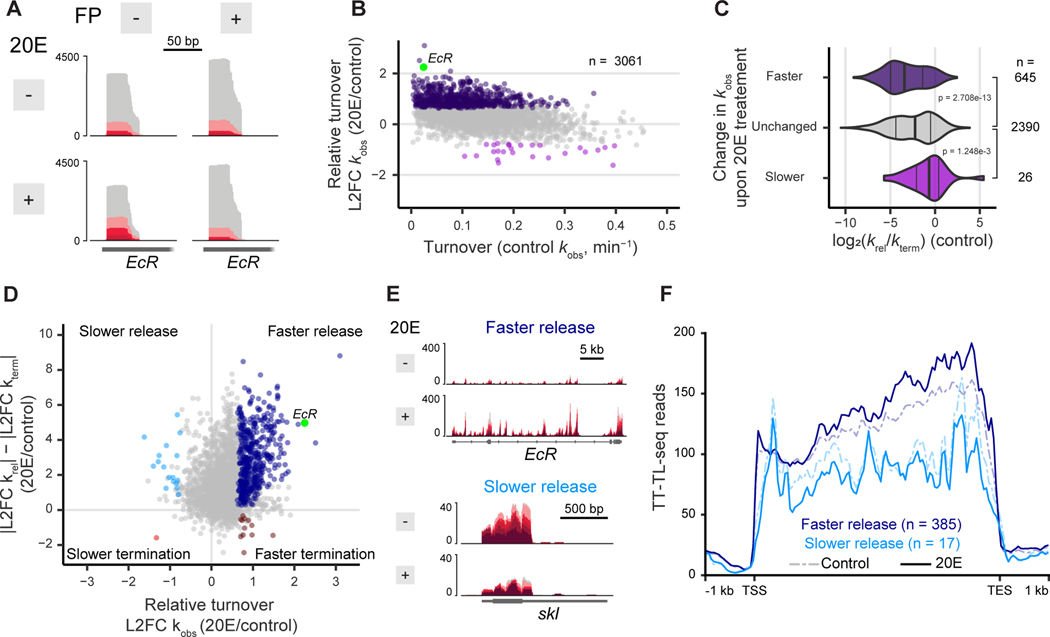
Figure 5. Hormonal stimulus by 20E preferably regulates release into elongation.
(A) STL-seq tracks of the EcR gene TSS when treated with or without 20E and with or without flavopiridol inhibition.
(B) Total observed rate constants of high confidence promoters plotted versus the log2 fold change when S2 cells are stimulated with 20E for thirty minutes. Points are colored if the 80% credible interval is greater than log2(1.5) (dark purple) or less than -log2(1.5) (light purple). The EcR TSS shown in A is highlighted in green.
(C) Distribution of the log2 ratio of the pause-release rate versus termination rate at promoters grouped by the change in the total turnover as determined in B. Significance was assessed by a two-sided Wilcoxon rank sum test.
(D) The log2 fold change of promoters plotted versus the difference of the magnitudes of the log2 fold change of the release and termination constants upon 20E stimulus. Points are colored if the 80% credible interval of L2FC is entirely greater than log2(1.5) or less than -log2(1.5) and if the 80% credible interval of the difference in magnitudes does not overlap zero. The EcR TSS shown in A is highlighted in green.
(E) TT-TL-seq tracks of EcR and skl +/− 20E stimulus as examples of genes where 20E-induced changes in scRNA turnover are driven by faster or slower pause release, respectively.
(F) Metaplots of TT-TL-seq signal without (dashed) and with (solid) 20E stimulus separated by whether release from the TSS was faster (dark blue) or slower (light blue) upon 20E stimulus as determined in D. Coverage is determined over 50 nt bins.

