Figure 3.

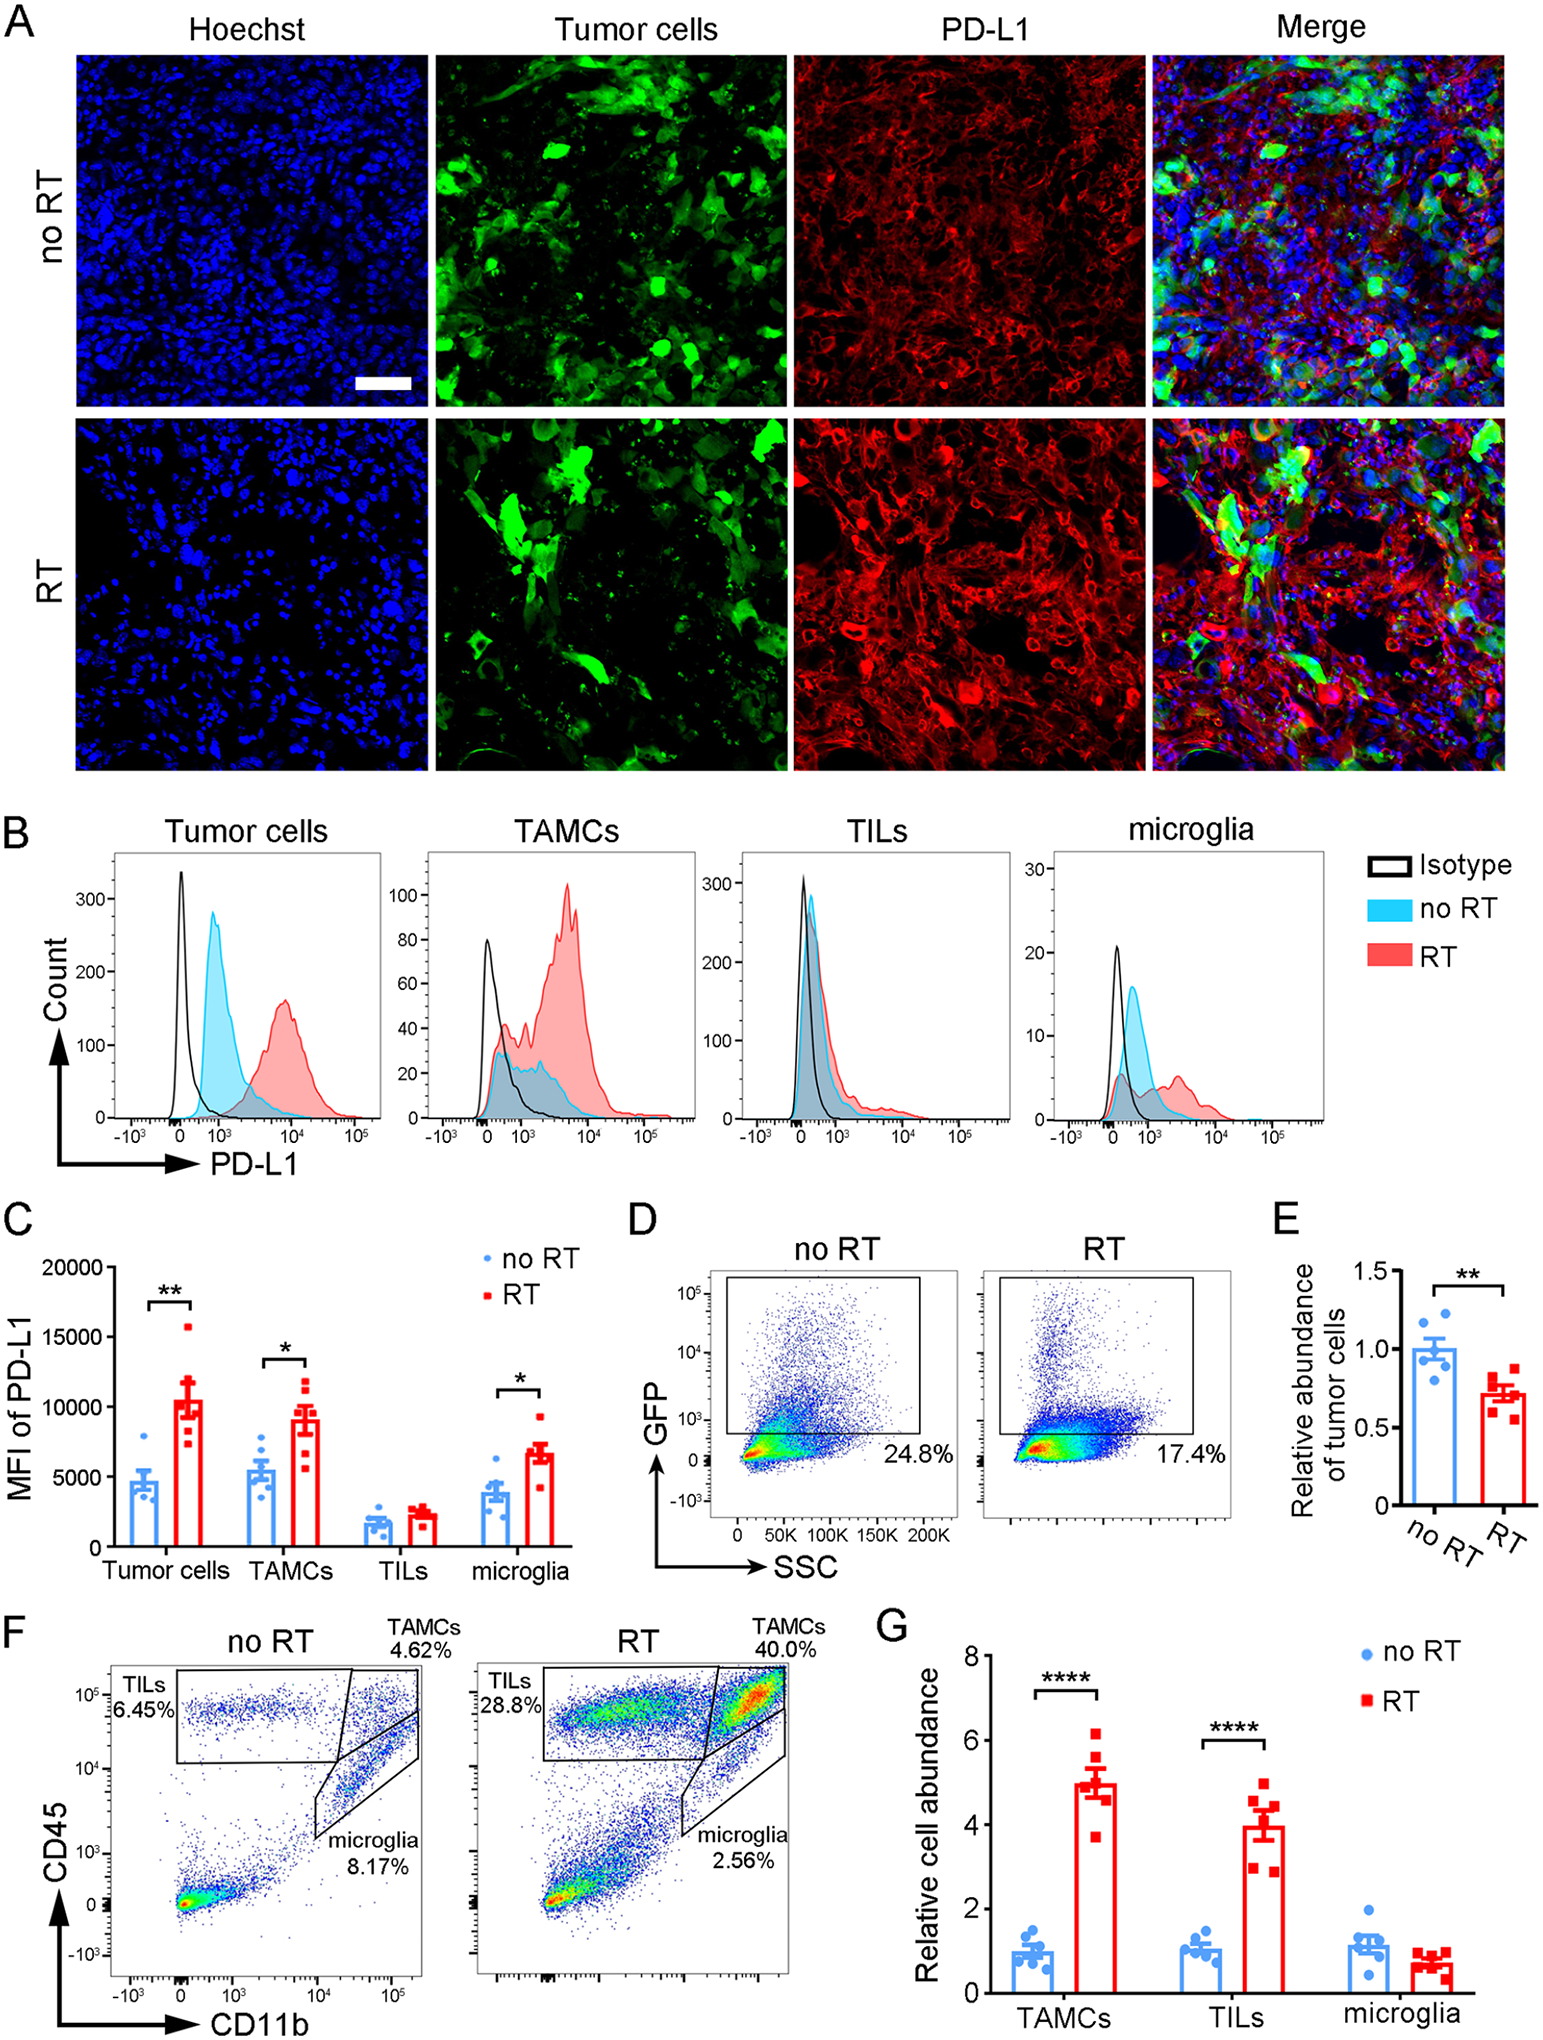
RT induces upregulation of PD-L1 in GBM and the immune microenvironment. (A) Fluorescence analysis on GL261 brain tumor (GFP) slices from irradiated and nonirradiated tumors after staining for PD-L1 (red) and Hoechst nuclei (blue); scale bar, 50 μm. (B,C) Flow cytometric analysis of PD-L1 expression among GBM cells and infiltrating immune cells (TAMC, TIL, microglia) post-RT (or control). Representative histograms of PD-L1 (B) and MFI (C). (D,E) Quantification of tumor cells abundance as determined by the percentage of GFP+ population. (F) Gating strategy for different immune cells (TILs, CD45high CD11b−; TAMCs, CD45high CD11b+; microglia, CD45int CD11b+) and percentages of immune cell subsets. (G) Relative cell abundance of TAMCs, TILs, and microglia determined by flow cytometry. Data are presented as mean ± SEM (n = 6); *P < 0.05, **P < 0.01, ***P < 0.001, ****P < 0.0001by student’s t-test.
