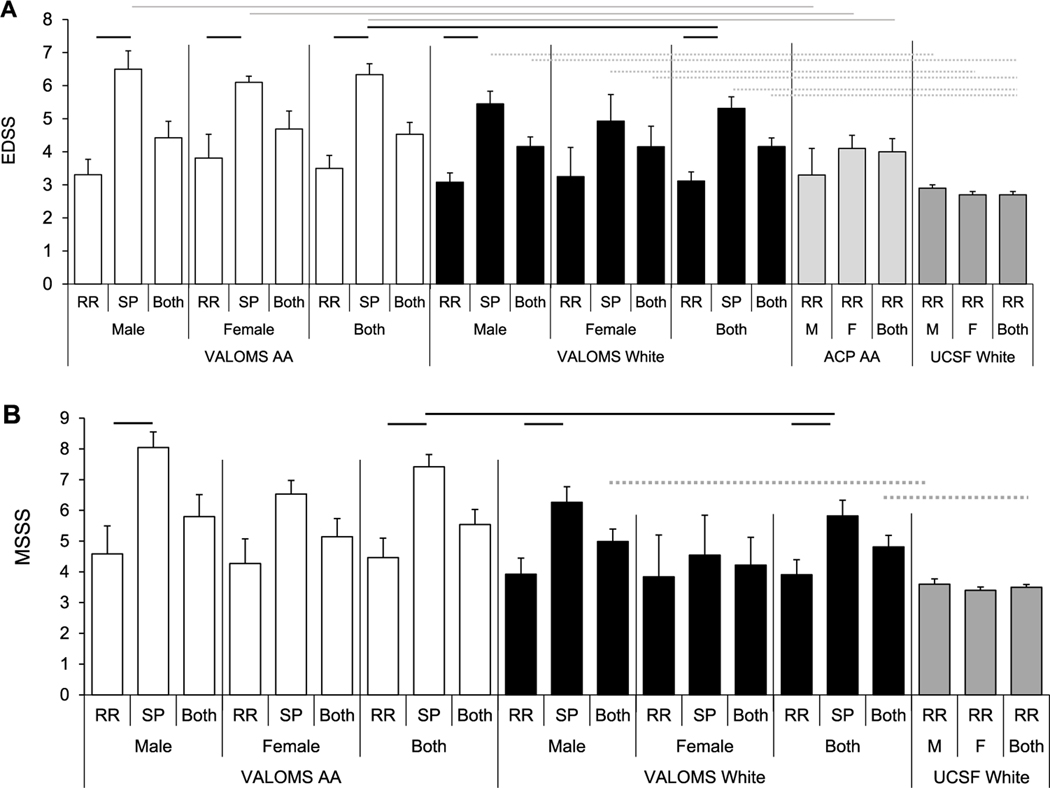
Fig. 3.
MS disease severity in AA and White patients with MS
Average (A) EDSS scores measured at last exam and (B) MSSS for VALOMS AA (white bars), VALOMS White (black bars), ACP AA (light gray bars in A), and UCSF White (dark gray bars in A and B) PwMS. Significance (P<0.05) is indicated by black lines comparing VALOMS AA and White patients; gray lines comparing VALOMS to ACP AA PwMS; and dashed lines comparing VALOMS to UCSF White PwMS. Data is mean ± se and are taken from Supplemental Table 1.

