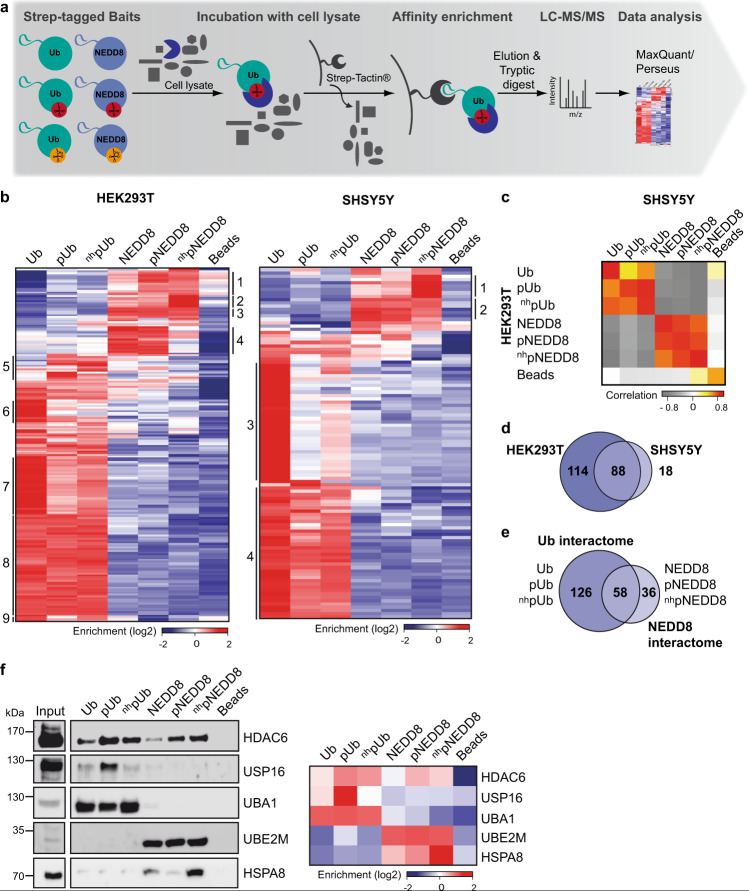
Fig. 4. Identification of the interactome of phosphorylated Ub and NEDD8.
a Schematic overview of the AE-MS workflow for the identification of pUb and pNEDD8 interacting proteins. The bait molecules Ub, pUb, nhpUb, NEDD8, pNEDD8, or nhpNEDD8 were used as affinity matrices. Empty beads were used as control. n=3 biologically independent experiments measured in technical duplicates. b Hierarchical clustering of statistically significant interacting proteins (rows) and the different bait molecules (columns) in HEK293T and SHSY5Y cell lysates. Thresholds for the ANOVA statistics were set as follows: FDR = 0.02, S0 = 1. Enrichment is indicated in red, whereas lack of enrichment is indicated in blue. Numbers of the different clusters are indicated on both sides. c Plot of the heatmap of pairwise correlation between significantly enriched interactors for each bait in HEK293T and SHSY5Y cell extracts. A strong correlation is indicated in red, medium correlation in yellow, no correlation in white and anti-correlation in grey. d Venn diagram showing the overlap of significantly enriched interactors for the pull-down performed with HEK293T and SHSY5Y cell lysates. e Overlap between the combined significantly enriched interactors of all Ub and all NEDD8 variants. HEK293T and SHSY5Y data were combined. For the heatmap of pairwise correlation between significantly enriched interactors for each bait see Supplementary Fig. 7. f Confirmation of interactions by Western blot analysis. 10% of the elution fraction of the affinity enrichment assays were subjected to Western blot analysis with antibodies specific for the respective protein. Input represents 1% of the HEK293T cell lysate used for affinity enrichment. The Western blot shown is representative of three independent experiments. Source data are provided as a Source Data file.

