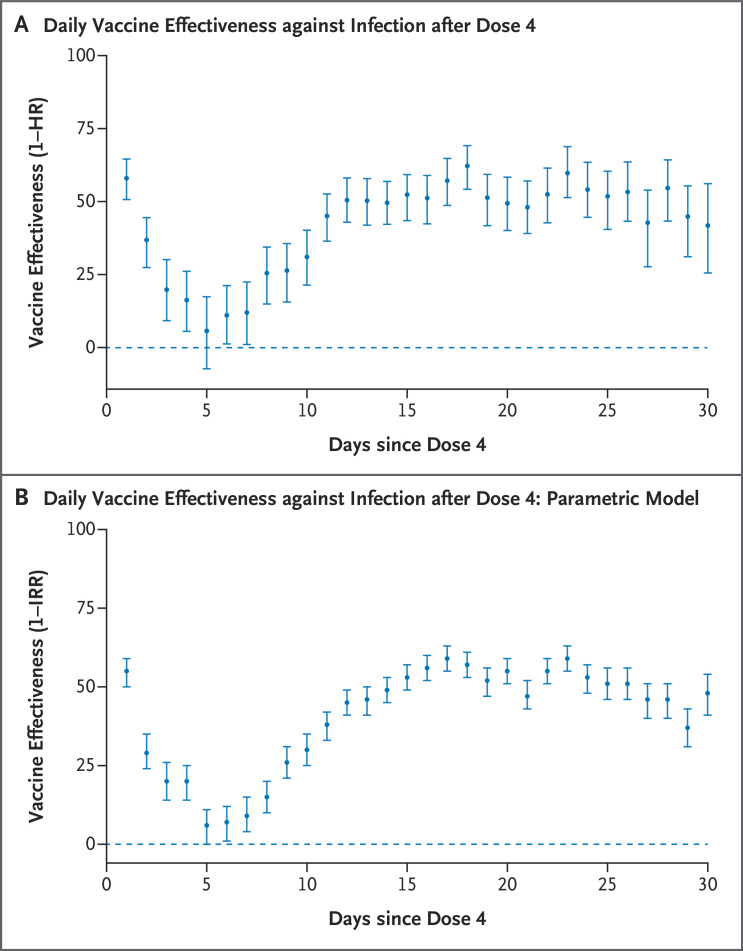
Figure 3. Daily Vaccine Effectiveness in the Primary Analysis and the Poisson Regression Analysis.
Panel A shows daily estimated vaccine effectiveness (1 minus the daily hazard ratio [HR]) against PCR-confirmed SARS-CoV-2 infection after a fourth vaccine dose as compared with a third vaccine dose (≥4 months earlier). 𝙸 bars indicate the 95% confidence interval. The analysis was performed with the bootstrap method (500 repetitions) on the Kaplan–Meier estimate. Panel B shows the daily estimated vaccine effectiveness (1 minus the incidence rate ratio [IRR]) against PCR-confirmed SARS-CoV-2 infection after a fourth vaccine dose as compared with a third vaccine dose (≥4 months earlier). 𝙸 bars indicate the 95% confidence interval. The analysis was performed with the use of Poisson regression as part of a sensitivity analysis. In each panel, values above the dashed line indicate that four doses are more effective than three doses received at least 4 months earlier.

