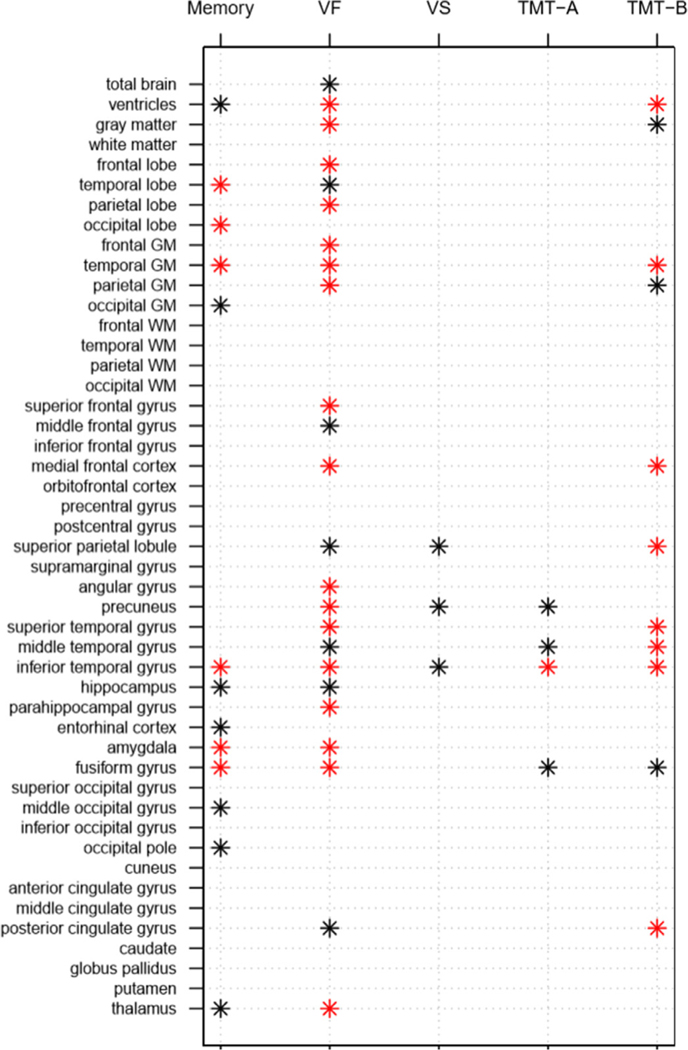
Fig. 1.
Summary of findings for correlations of rates of change between each cognitive domain/test and each brain region of interest in cognitively normal older adults in the Baltimore Longitudinal Study of Aging. Note: red * indicates p < 0.01 and black * indicates p < 0.05. VF – verbal fluency; VS – visuospatial ability; GM – gray matter; WM – white matter; TMT – Trail-Making Test.

