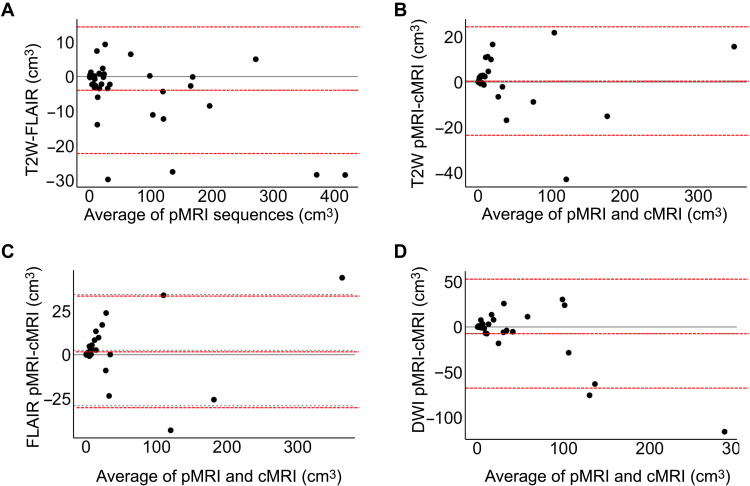
Fig. 6. Bland-Altman plots of stroke volume measurements.
Bland-Altman plots are shown for (A) pMRI T2W and FLAIR sequences {bias of −3.92 cm3 [limits of agreement (LOA): −22.26 to 14.43 cm3]}, (B) T2W pMRI and cMRI sequences [bias of 0.50 cm3 (LOA: −23.46 to 24.46 cm3)], (C) FLAIR pMRI and cMRI sequences [bias of 2.61 cm3 (LOA: −29.18 to 34.40 cm3)], and (D) DWI pMRI and cMRI sequences [bias of −7.15 cm3 (LOA: −67.59 to 53.29 cm3)]. Bias and LOA are shown by the dotted lines.

