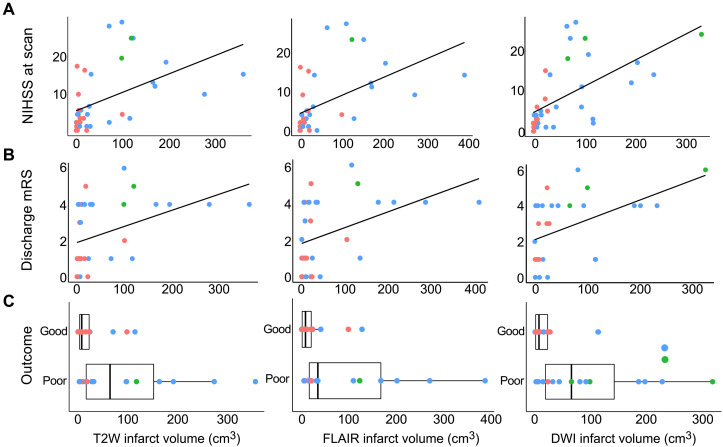
Fig. 7. Stroke volume and clinical status.
Low-field pMRI infarct volume measurements predicted (A) stroke severity at the time of scan [Spearman correlation (rs); T2W: rs = 0.583, P < 0.001; FLAIR: rs = 0.623, P < 0.001; DWI: rs = 0.696, P < 0.001] and (B) mRS scores at discharge (T2W: rs = 0.487, P < 0.01; FLAIR: rs = 0.465, P < 0.01; DWI: rs = 0.503, P < 0.01). (C) Boxplots illustrating stroke volumes for patients with good functional outcome (mRS: 0 to 3) and poor functional outcome (mRS: 4 to 6). Compared to patients with good functional outcome, those with poor functional outcomes had larger infarct volumes measured on pMRI T2W (P < 0.01), FLAIR (P < 0.01), and DWI (P < 0.01) sequences. Phase of stroke is shown in color (red, acute; blue, subacute; green, chronic).

