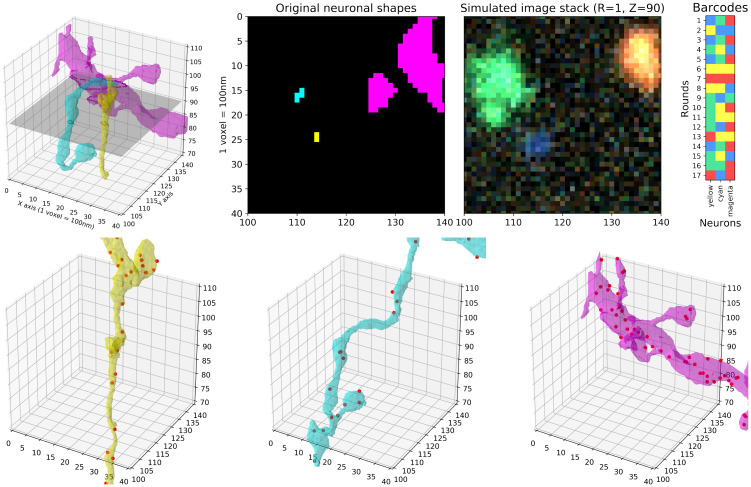
Fig 2. Simulation process illustration.
Top left: Three neuronal segments in a small region (40 × 40 × 40 voxels with 100 × 100 × 100 nm voxel size). The original EM data is much more densely packed than what is shown here; for illustration purposes, we only show three neurons among many. Top middle: A 2D slice with each neuronal segment uniquely colored (left) and the simulated imagestack at the same plane for the first sequencing round (right). The imagestack colors do not correspond to neural segment colors, but rather to the corresponding fluorescent barcodes (top right). A video corresponding to this plot, showing multiple z-planes, can be found at this link. Bottom: Amplicons are uniformly simulated within neuronal segment volumes; simulated amplicons are shown as red dots.

