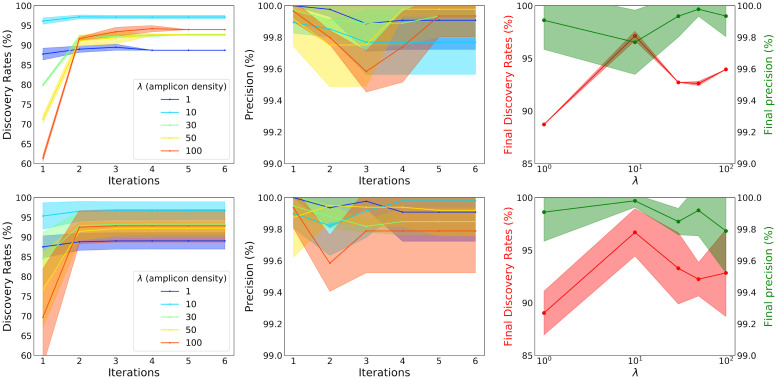
Fig 5. An iterative non-negative matrix factorization approach enables barcode discovery in the high-amplicon-density regime for high-resolution, dense-expression simulations.
Top: five datasets are randomly simulated from a single EM volume and performances are summarized here. The left panel shows barcode discovery rate, as a fraction of the 975 neurons present in the original EM volume. The middle panel shows the precision at each iteration, which is the proportion of True Positives among all the positive detections. These two panels show these metrics evaluated on STIBEs with various densities of amplicons (λ, colored lines) analyzed using different numbers of iterations. The shaded regions for each line indicate the standard deviation. We see that multiple iterations improve recovery accuracy when the density of amplicons is high. The right panel shows the final discovery rate (vertical axis on the left, red) as well as the final precision (vertical axis on the right, green) after six iterations, as a function of amplicon density (at log-scale, horizontal axis). Recovery accuracy peaks at λ values around 10 amplicons/μm3, where amplicons are neither too dense (where too much optical overlap leads to decreases in recovery accuracy) nor too sparse (where there is simply not enough information to recover some barcode identities). Bottom: five datasets are randomly simulated from five different EM volumes and the performances are summarized here. The plots are arranged in the same way as above. Here we see a very similar trends, albeit with larger variations across the replicates, confirming the results generalize across multiple FOVs. These plots further confirmed that 10 amplicons/μm3 is an optimal value for this iterative barcode discovery task, under these simulated imaging conditions.

