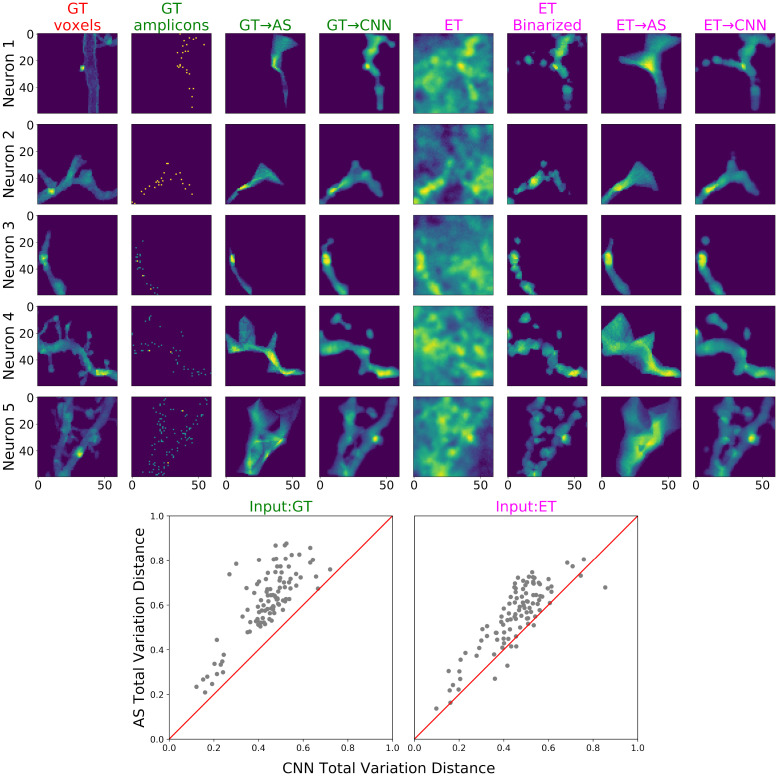
Fig 9. Comparing the morphology reconstruction for high-resolution, dense-expression simulations, using alphashape (AS) and CNN, with either ground-truth (GT) amplicons or evidence tensor (ET) as input.
Top: Morphology prediction results for 5 examples. All the columns show the sum-projections across z-planes. The first column shows the ground-truth morphology. The next three columns show the prediction results using alphashape or CNN, when the ground-truth amplicons are used as input (indicated in green titles). The following four columns show the prediction results using alphashape or CNN, when the evidence tensors are used as input (indicated in magenta titles). Evidence tensors are first calculated using the correlation method described in S1A.3.1 Appendix, and before input into alphashape, they are binarized with threshold 0.7, as shown (again, see S1 Fig for details on the choice of this threshold). Bottom: Total variation distance (see S1A.3.2 Appendix) on 100 testing examples, including the five shown on the top panel, comparing the results from alphashape prediction on the input (y-axis) and CNN prediction on the input (x-axis). Each dot represents one testing example. The red lines indicate where the two methods have the same performance. Lower values are better; the CNN significantly outperforms the alphashape reconstructions here. A video of the reconstruction result (across z-planes) can be found at this link.

