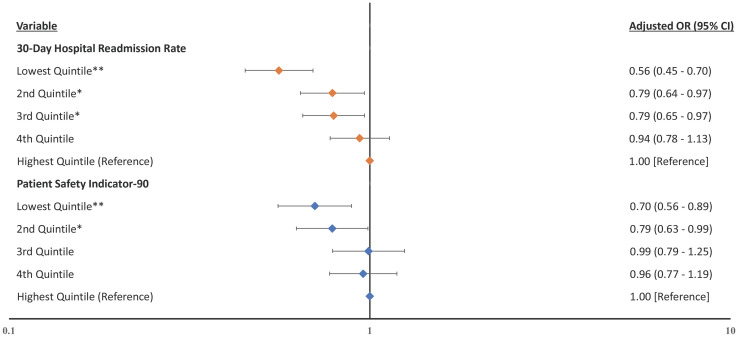
Fig 3. Forest plot of the odds ratios for the association between same year’s measured quality and financial distress.
Hospitals within the lowest 30-day hospital-wide readmission rate quintile and hospitals within the lowest PSI-90 score quintile experienced lower odds of financial distress compared to their respective highest quality quintiles. Notes: Forest plot showing the adjusted odds ratios with financial distress as the dependent variable with quality indicators as independent variables and adjusted for the hospital characteristics. Higher rates and scores represent worse quality. * p ≤ .05 **p ≤ .01.

