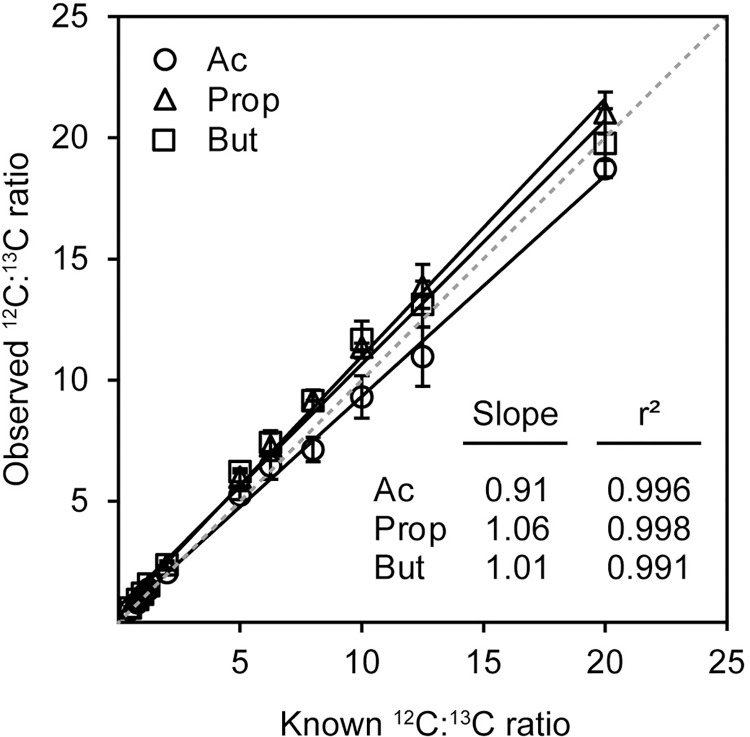
Fig 2. Correlation between known and observed 12C:13C ratios.
Plot of linear regression for known 12C:13C ratios versus observed 12C:13C ratios for 11 standard mix solutions with 12C- and 13C- SCFAs concentration ratios ranging from 0.5 to 20. Slopes for fitted regression lines and r2 corresponding to plots are shown. Dashed line represents a slope of 1. Error bars represent standard deviation, n = 3 technical replicates.

