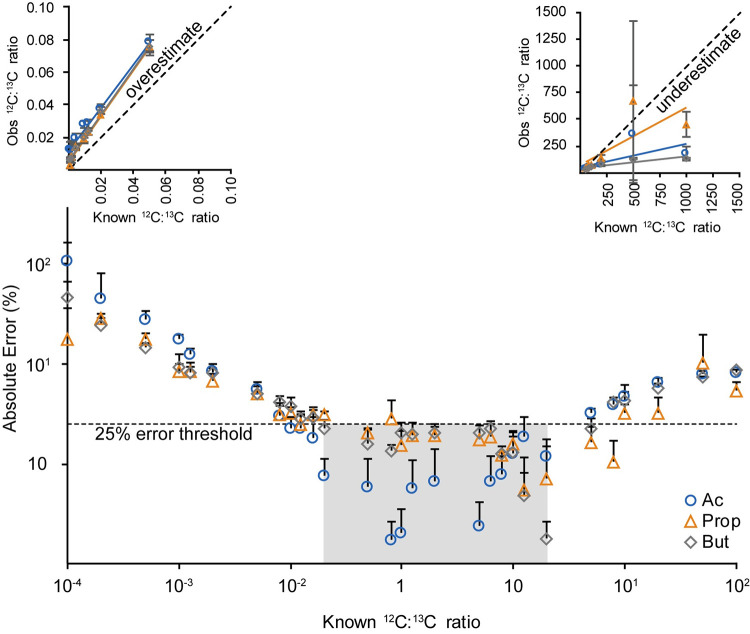
Fig 3. Relationship between 12C:13C isotope ratio for SCFAs and the observed absolute error.
The dotted line denotes an arbitrary 25% error threshold. Colored square highlights the range of concentration ratios (0.5 < 12C:13C ratio < 20) where the absolute error is below 25%. (Insets show plots for the observed MS signal intensity ratio versus the known concentration ratio for (left) concentration ratios between 0.001 and 0.05 and (right) concentration ratios between 50 and 1000). Error bars indicate standard deviation, n = 3 technical replicates.

