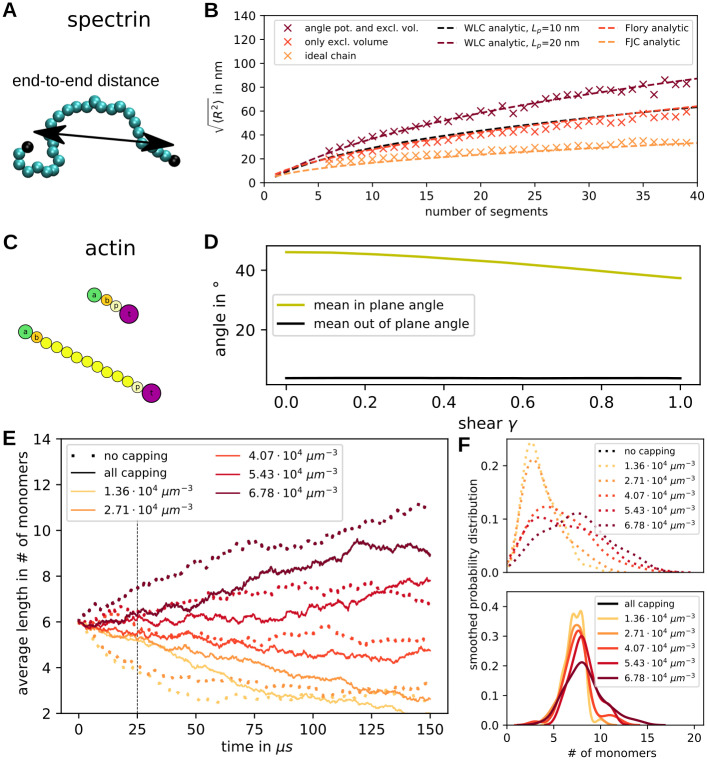
Fig 3. Spectrin and actin filaments.
(A) Spectrin properties are tested by examining the end-to-end distance exemplified by the double arrow. (B) The root-mean-square value of the end-to-end distance is calculated for varying filament length. Simulations with an angle potential and excluded volume (wine) are compared to ones without angular confinement in red and simulations of ideal chains (i.e. no angle or excluded volume interactions) in orange. Additionally, we plot the analytic expression for the WLC (wine), the Flory theory (red) and the freely-joined chain (orange). (C) Capped actin filaments of different lengths. (D) The orientation of actin filaments within a network is quantified by the in-plane angle (orientation within the membrane) and the out-of-plane angle (angle in z-direction). These are plotted as a function of shear of the network. (E) The temporal evolution of actin filament average length is plotted for different initial values of G-actin concentration. The solid line shows the data from simulations containing capping proteins and the dotted lines show data from simulations without capping proteins. Each line corresponds to one simulated network with 46 actin filaments. The dashed vertical line indicates the time point for which the distributions are shown in F. (F) The smoothed probability distributions of the filament lengths at time 25 μs are shown for all concentrations. At the top the data is shown for simulations without capping proteins and at the bottom with capping proteins.

