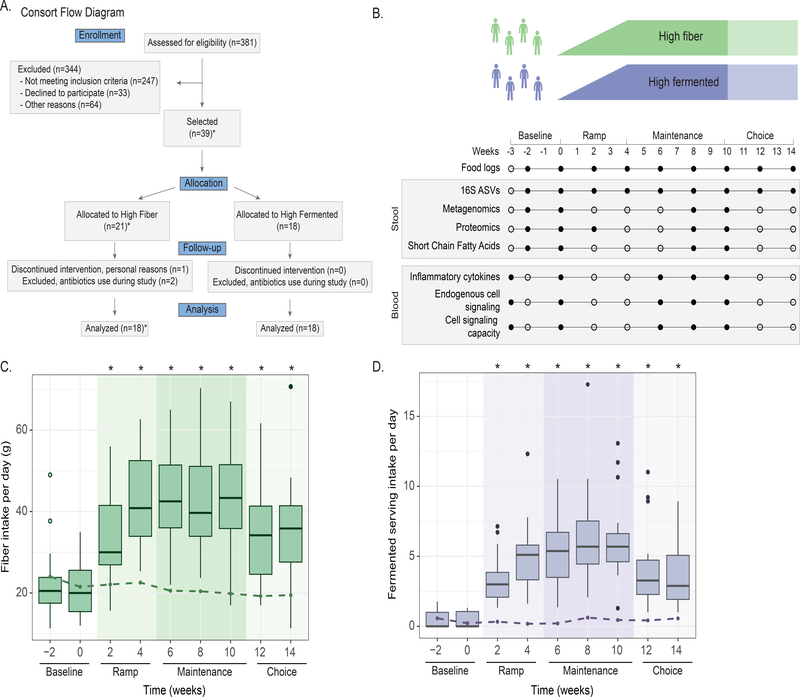
Figure 1. Overview of Fiber Fermented Food Study.
(A) Consort flow diagram for participant enrollment, allocation, follow-up, and analysis. Side chart shows the number of participants in high-fiber (Fi) and high-fermented (Fe) diet arm collected for each platform. *2 participants were assigned to high fiber, not randomized, by special request.
(B) The 14-week study overview timeline, sample types collection, and corresponding experimental platforms.
(C) Fiber intake in the high-fiber diet arm shown in boxplots, fiber intake in the high-fermented food diet arm shown as dotted line.
(D) Fermented food intake in the high-fermented food diet arm shown in boxplots, fermented food intake in high-fiber diet arm shown as dotted line. P-values ≤ 0.05 via t-test denoted by asterisks and calculated for each time point relative to baseline −2 week value.

