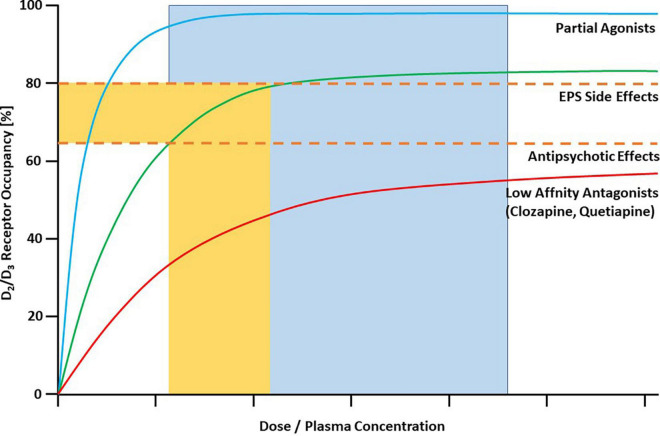
FIGURE 1.
Characteristic binding curves of antipsychotic drugs in human striatum as measured with PET. Dashed lines represent threshold occupancy values for EPS (80%) and antipsychotic effects (65%). Most antipsychotics, including most of the SGAs, are characterized by the green line. They reach optimal occupancy (65–80%) in a “therapeutic window” of corresponding plasma concentrations. Antipsychotics with low affinity for D2/D3 receptors are described by the red line. Even at very high plasma concentrations they usually do not cross the 80% threshold for EPS. They exert antipsychotic effects despite relatively low occupancy in the striatum. All clinically available partial agonist antipsychotics are characterized by the blue binding curve. They have antipsychotic effects only at almost total saturation of D2/D3 receptors (in the flat part of the curve), represented by the blue area. The upper threshold is not sharply defined. Copyright © 1969, Elsevier. From (1).

