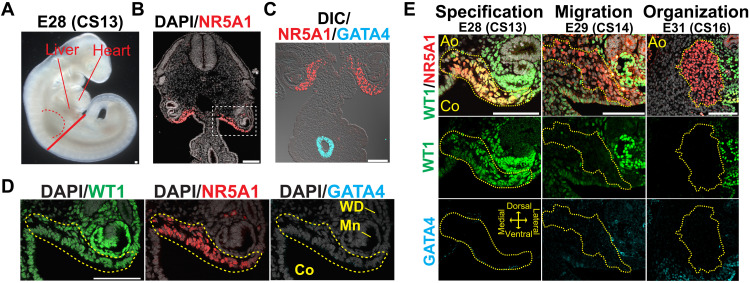
Fig. 2. Specification of the adrenocortical lineage in cynomolgus monkeys.
(A) Bright-field image of a cynomolgus embryo at E28 (CS13). The red dashed line denotes the forelimb bud. The solid red line indicates the approximate plane where the transverse sections were taken for IF analysis. (B and C) IF images of the section for NR5A1 (red) merged with DAPI (white) (B) or GATA4 (cyan), and differential interference contrast (DIC) image (white) (C). Scale bars, 100 μm. (D) Magnified images of the region outlined in (B) for WT1 (green), NR5A1 (red), and GATA4 (cyan), merged with DAPI (white). NR5A1+ adrenogenic CE are outlined by the yellow dashed line. Scale bar, 100 μm. (E) IF images of the coelomic angle of cynomolgus embryos at the indicated morphogenetic and embryonic stages for WT1 (green), NR5A1 (red), and GATA4 (cyan). Merged images for WT1, NR5A1, and DAPI (white) are shown. The yellow dotted lines outline the adrenogenic CE or adrenal primordium. Scale bars, 100 μm.

