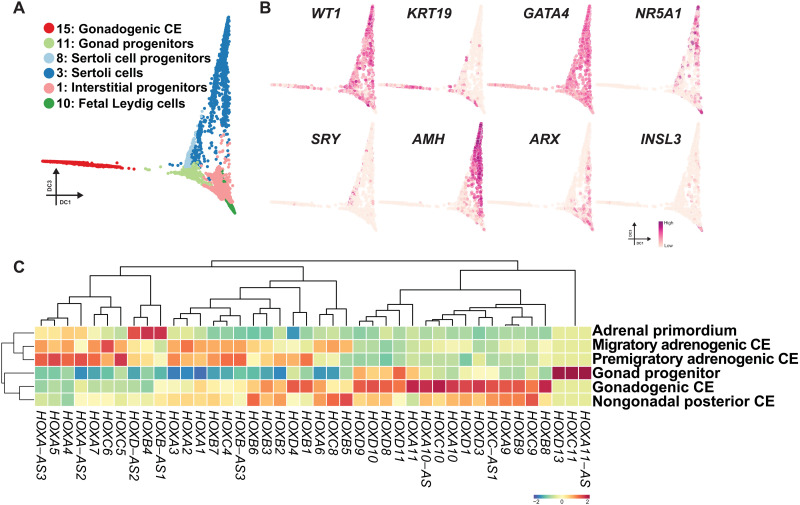
Fig. 4. Transcriptomic dynamics during the maturation of adrenocortical cells.
(A) Diffusion map showing the trajectory during human gonad development. Cells are colored according to cell cluster as in fig. S12C. (B) Key marker genes used for annotation of cell types projected on the diffusion map in (A). (C) Averaged expression values of HOX genes in the indicated cell clusters. HOX gene expression is z score normalized by each column, and cell clusters and genes are hierarchically clustered.

