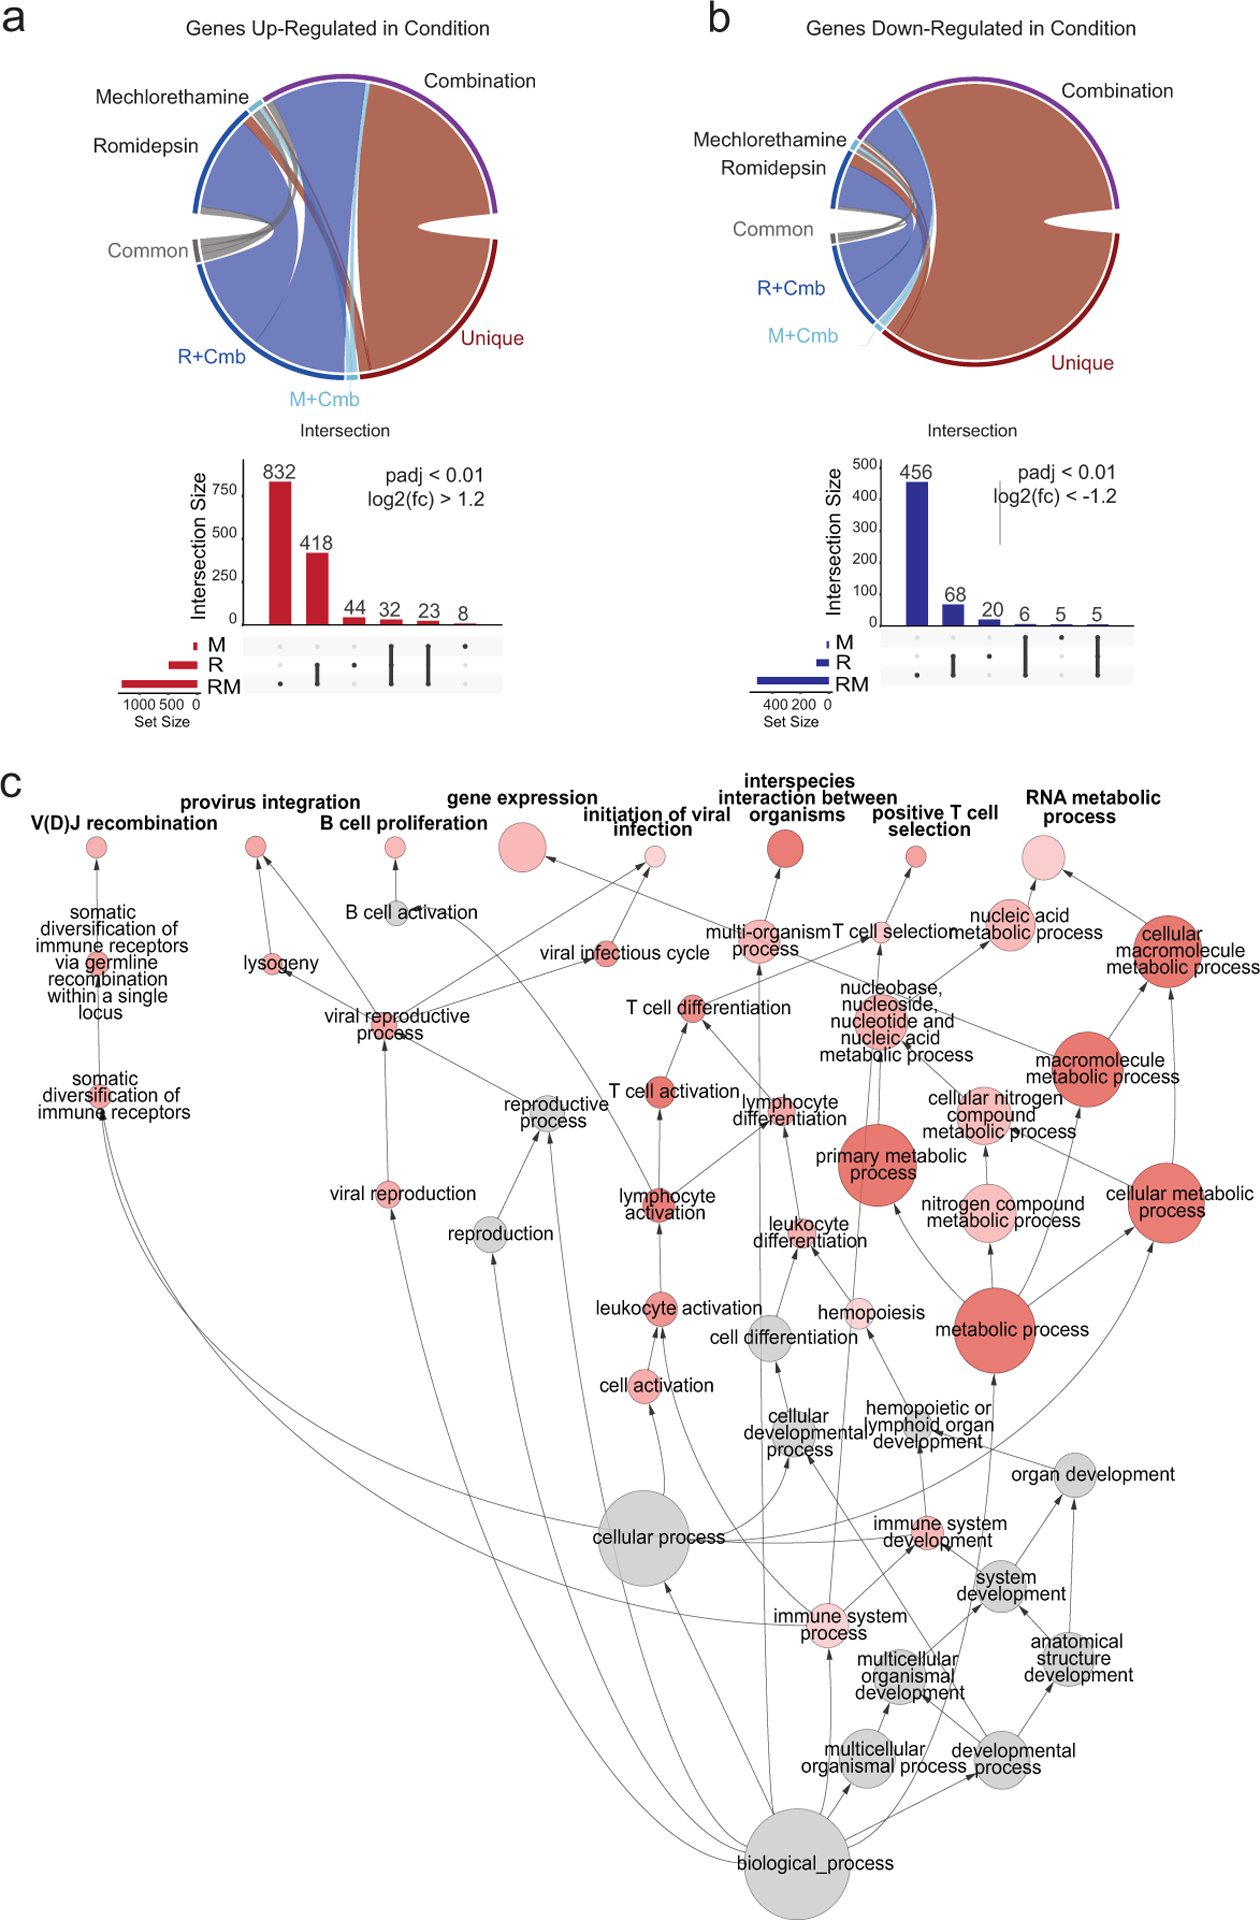
Figure 2. Analysis of expression changes induced by treatment with mechlorethamine, romidepsin and their combination in CTCL cell lines by RNAseq.

(a ,b) Circos plots indicate the relative proportions of significantly up- (a) and down-regulated (b) genes in each drug treatment condition versus vehicle control that were shared among all treatments (common), shared between the single treatments and the combination (R+Cmb or M+Cmb), or specific to the treatment (unique). Vertical bar plots display the absolute size of each intersection among the significantly up-regulated (in red) or down-regulated (in blue) genes. Horizontal bars indicate the absolute number of significantly up- or down-regulated genes among the different treatments, compared to vehicle control. (c) Directed network projection of the Gene Ontology biological process term analysis performed on genes. Node diameter indicates the relative number of genes in the GO term and the shading indicates the FDR level. R: romidepsin, M: mechlorethamine, Cmb: romidepsin plus mechlorethamine.
