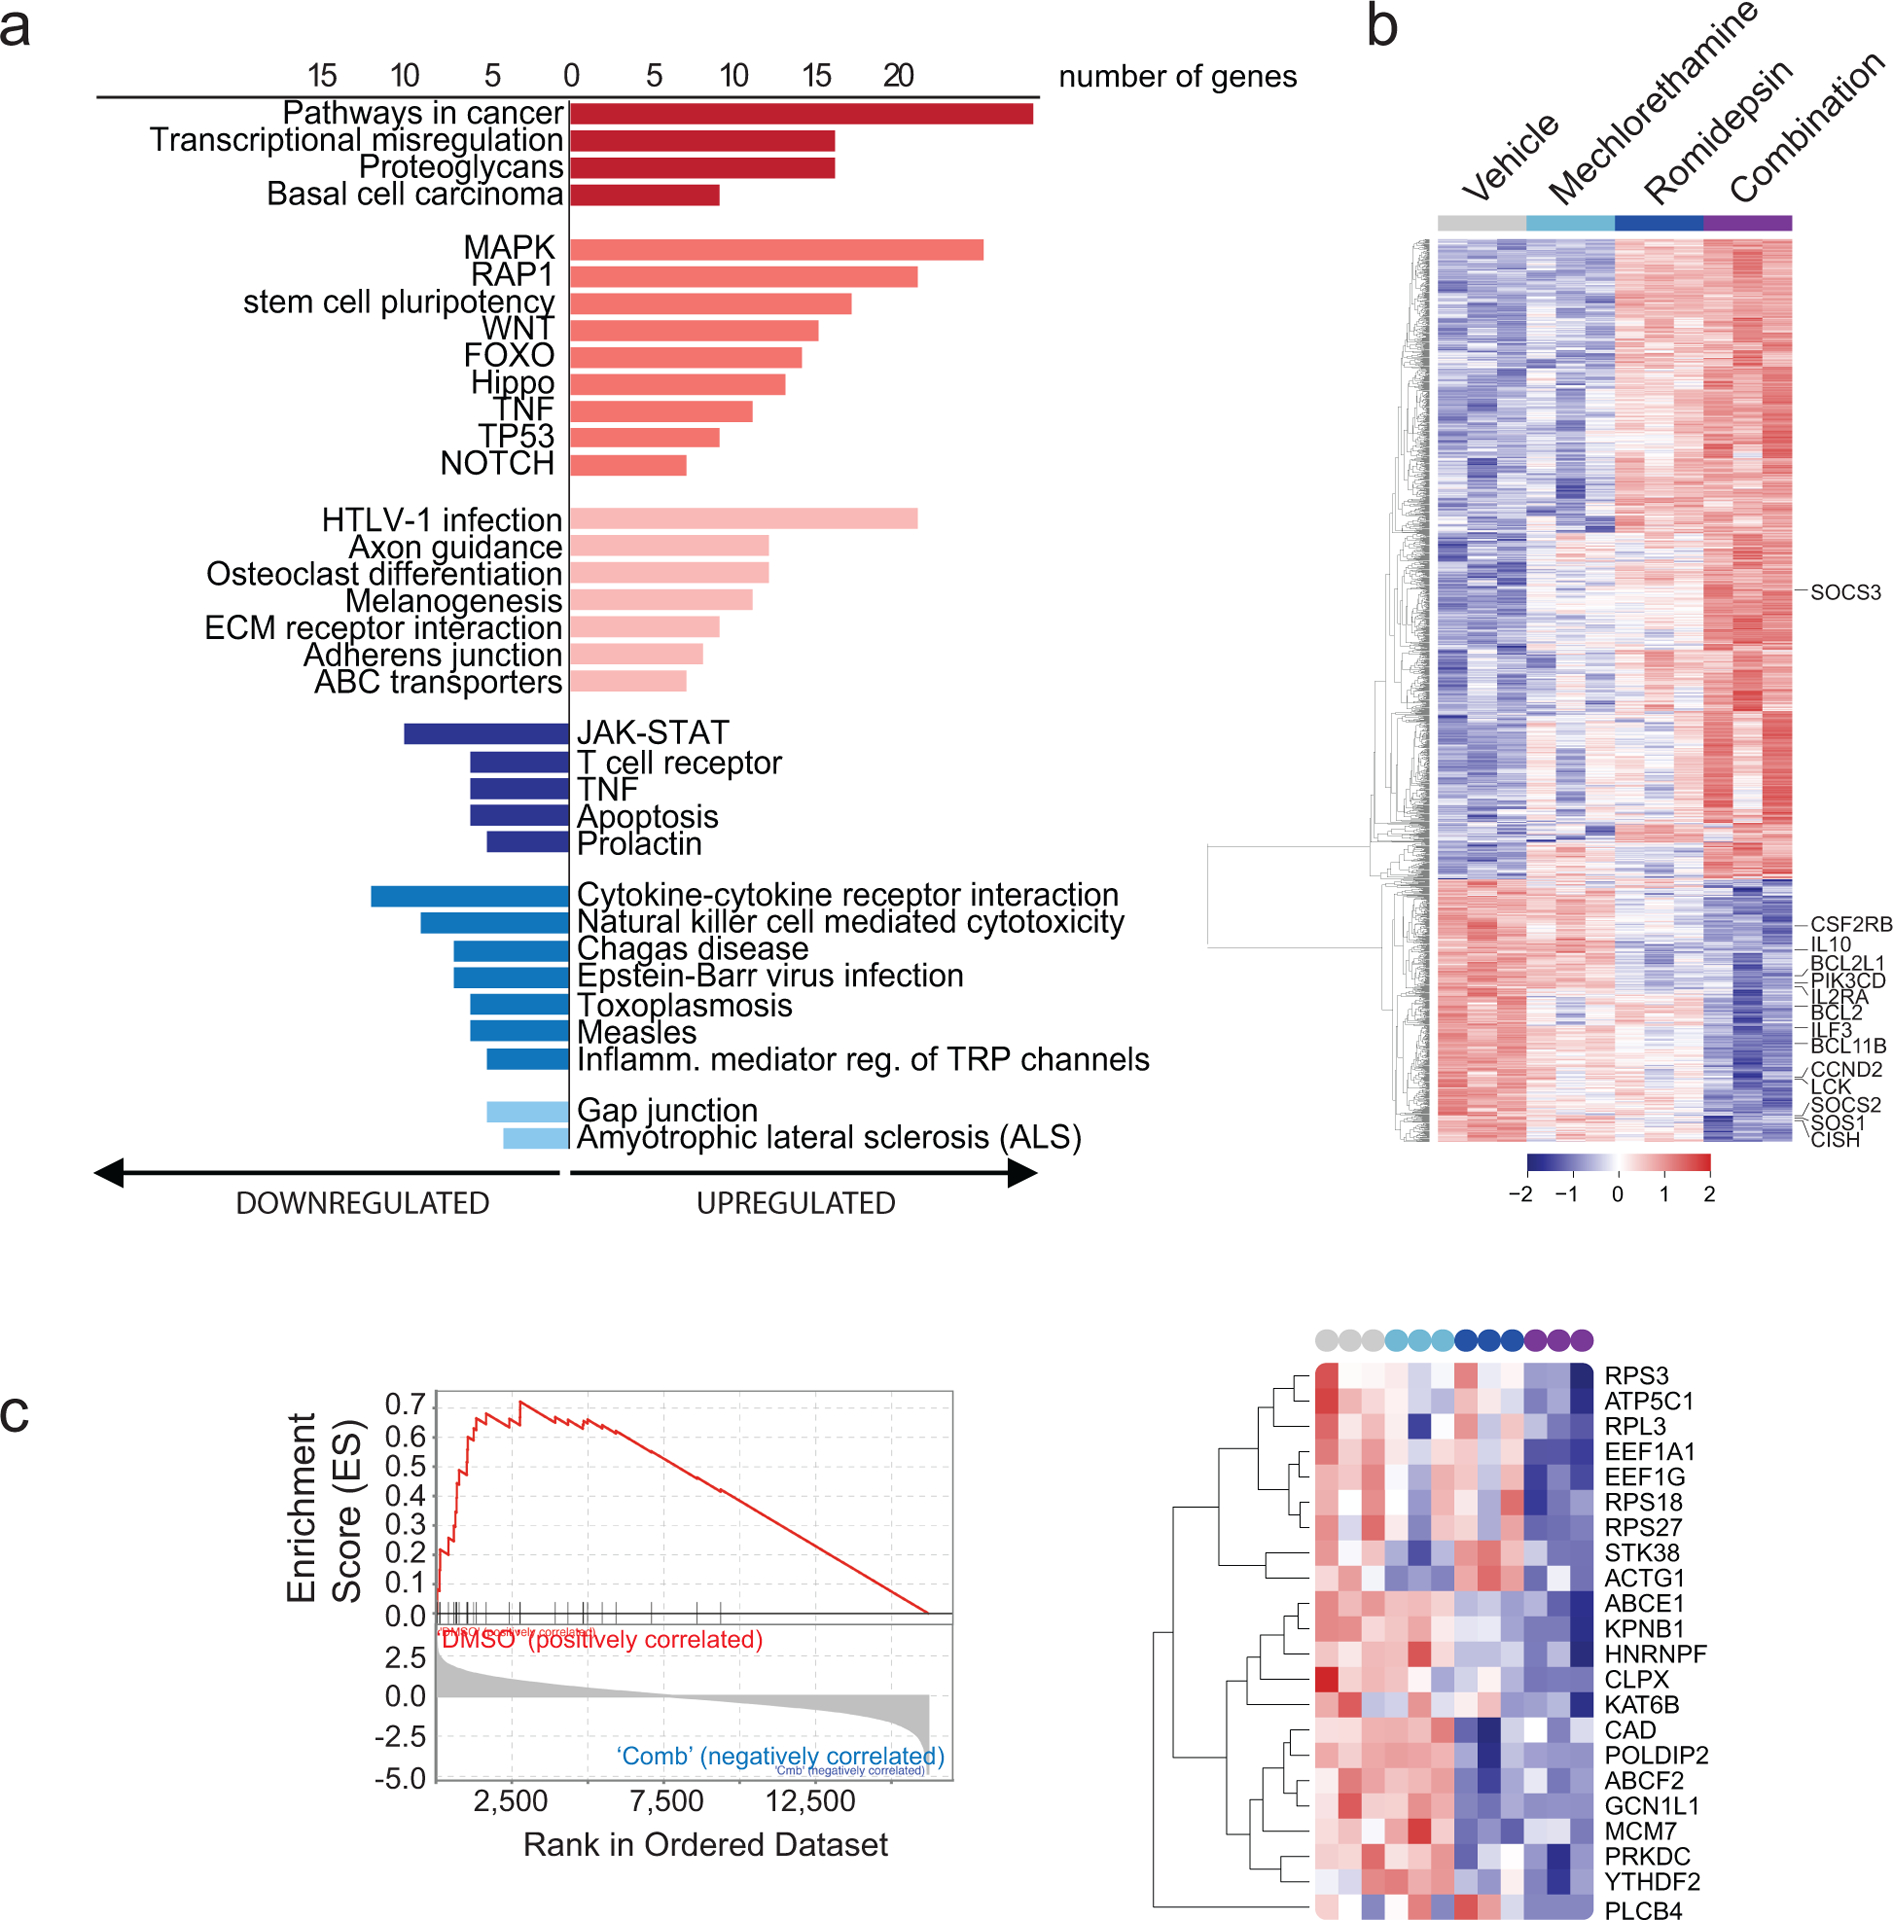
Figure 3. Pathway and Gene set enrichment analysis (GSEA) supports downregulation of the JAK/STAT signaling pathway in samples treated with the romidepsin-mechlorethamine combination.

(a) KEGG pathway analysis using DAVID 6.8 on the top differentially expressed genes in cell lines treated with the combination of romidepsin and mechlorethamine (p<0.01, log2fold-change>1.5 or <−1.5). Pathways with p<0.05 are shown. (b) Heatmap of the normalized expression of all significantly de-regulated genes in cell lines treated with Mechlorethamine alone, Romidepsin alone or both in combination compared to vehicle control. Genes were clustered by the complete linkage agglomerative hierarchical clustering method on the Euclidean distances. Cutoffs used to define significance in A, B and D were; padj < 0.01, logFC > 1.2. (c) Gene Set Enrichment Analysis revealed significant enrichment of the Pathway Interaction Database IL2-STAT5 Pathway gene signature (FWER p-Value < 0.001, NES 2.53 in vehicle-combination). Enrichment plot is presented in the left panel and normalized expression of the genes comprised by the leading edge of the signature are plotted in the heatmap in the right panel.
