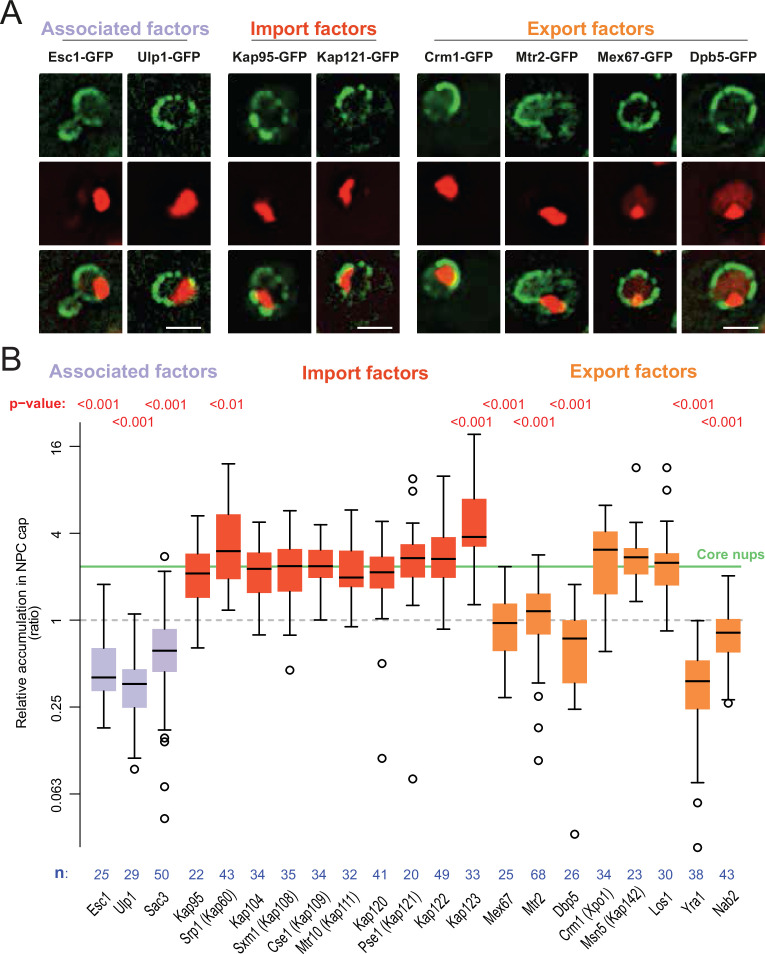
Figure 5. mRNA export and surveillance factors are displaced from circle-bound NPCs.
(A) Fluorescent images of nuclei in aged yeast cells, where the DNA circle clusters are labeled with TetR-NLS-mCherry (red) and transport factors with GFP (green). Scale bar is 2 µm. (B) Quantification of factor recruitment in the NPC cap adjacent to the DNA circle cluster, as in Figure 1E. The protein accumulation is plotted for associated factors (purple), import factors (red), and export factors (orange), and is compared to accumulation of the pooled NPC core subunits NPC (green line, duplicated from Figure 1E), no p-value is indicated if the difference is not significant. The sample size (n) is indicated.

