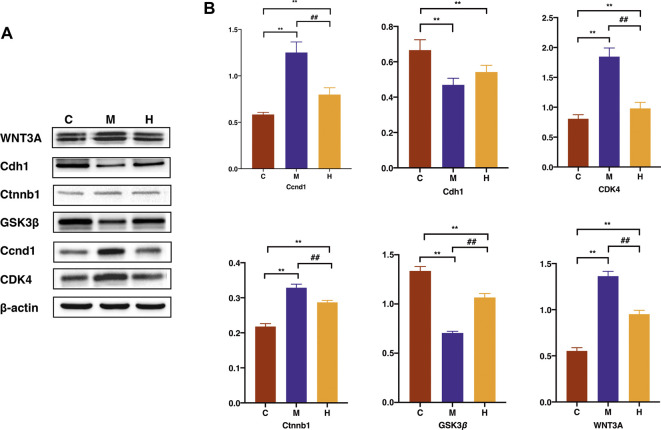
FIGURE 10.
Effects of HQT on differential protein expression in CAC mice. (A) Western blot analysis of WNT3A、Cdh1、Ctnnb1、GSK3β、Ccnd1 and CDK4 in mice colon tissues. (B) Statistical analysis of WNT3A、Cdh1、Ctnnb1、GSK3β、Ccnd1 and CDK4 gray values. Data are represented as the mean±SD (n = 3, ¯x±s). *p<0.05, **p<0.01 vs. normal control; #p<0.05, ##p<0.01 vs. model control. C: Normal control; M: Model control; H: HQT control.

