FIGURE 2.
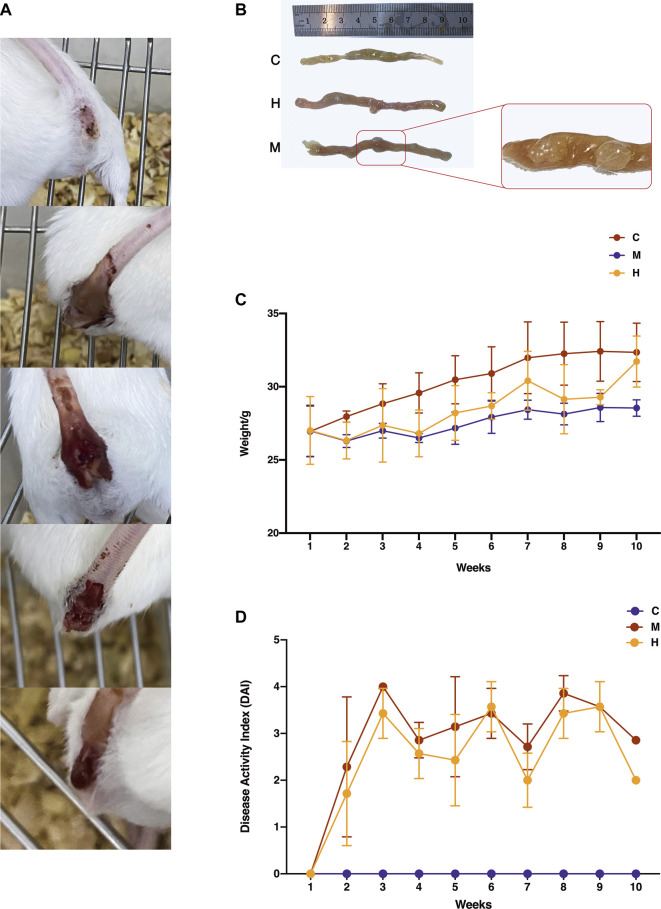
Effect of HQT on AOM/DSS-induced CAC mice. (A) Changes in fecal traits of model mice during the induction of AOM/DSS. As the modeling progressed (shown in the figure from top to bottom), mice gradually developed dilute stools, mucus stools, pus, and blood stools and finally detached and developed tumors. (B) Changes in colonic tissues of mice during AOM/DSS induction. C: Normal control (daily gavage of equal volume of saline); M: model control (combined AOM/DSS induction, daily gavage of equal volume of saline); and H: HQT control (combined AOM/DSS induction, daily gavage of 20 g kg−1 HQT). The number and size of tumors in the HQT group were smaller than those in the model group. (C) Body weight changes in mice during AOM/DSS induction. The weight of mice dropped sharply after the first administration of DSS and regained weight after the administration of HQT. (D) DAI scores of mice during AOM/DSS induction. The results showed that HQT groups had lower scores than the model group.

