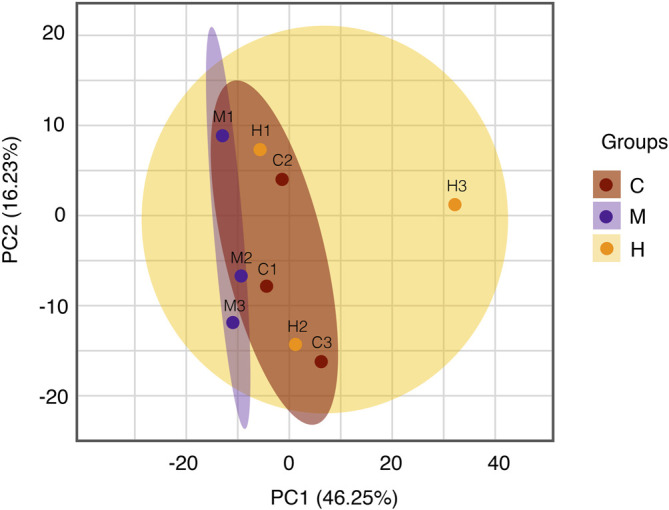
FIGURE 5.

PCA analysis. The central and vertical coordinates PC1 and PC2 indicate the scores of the first and second principal components, respectively, and the color of the scattered dots indicates the experimental grouping of samples. C: normal control; M: model control; H: HQT control, n = 3.
